Fully. LVGL tries to find a widget which fully covers the area to readraw and start rendering it, all its children all its younger siblings (as they can be on top of that widget) .
Hi, @kisvegabor,
Many Thanks!
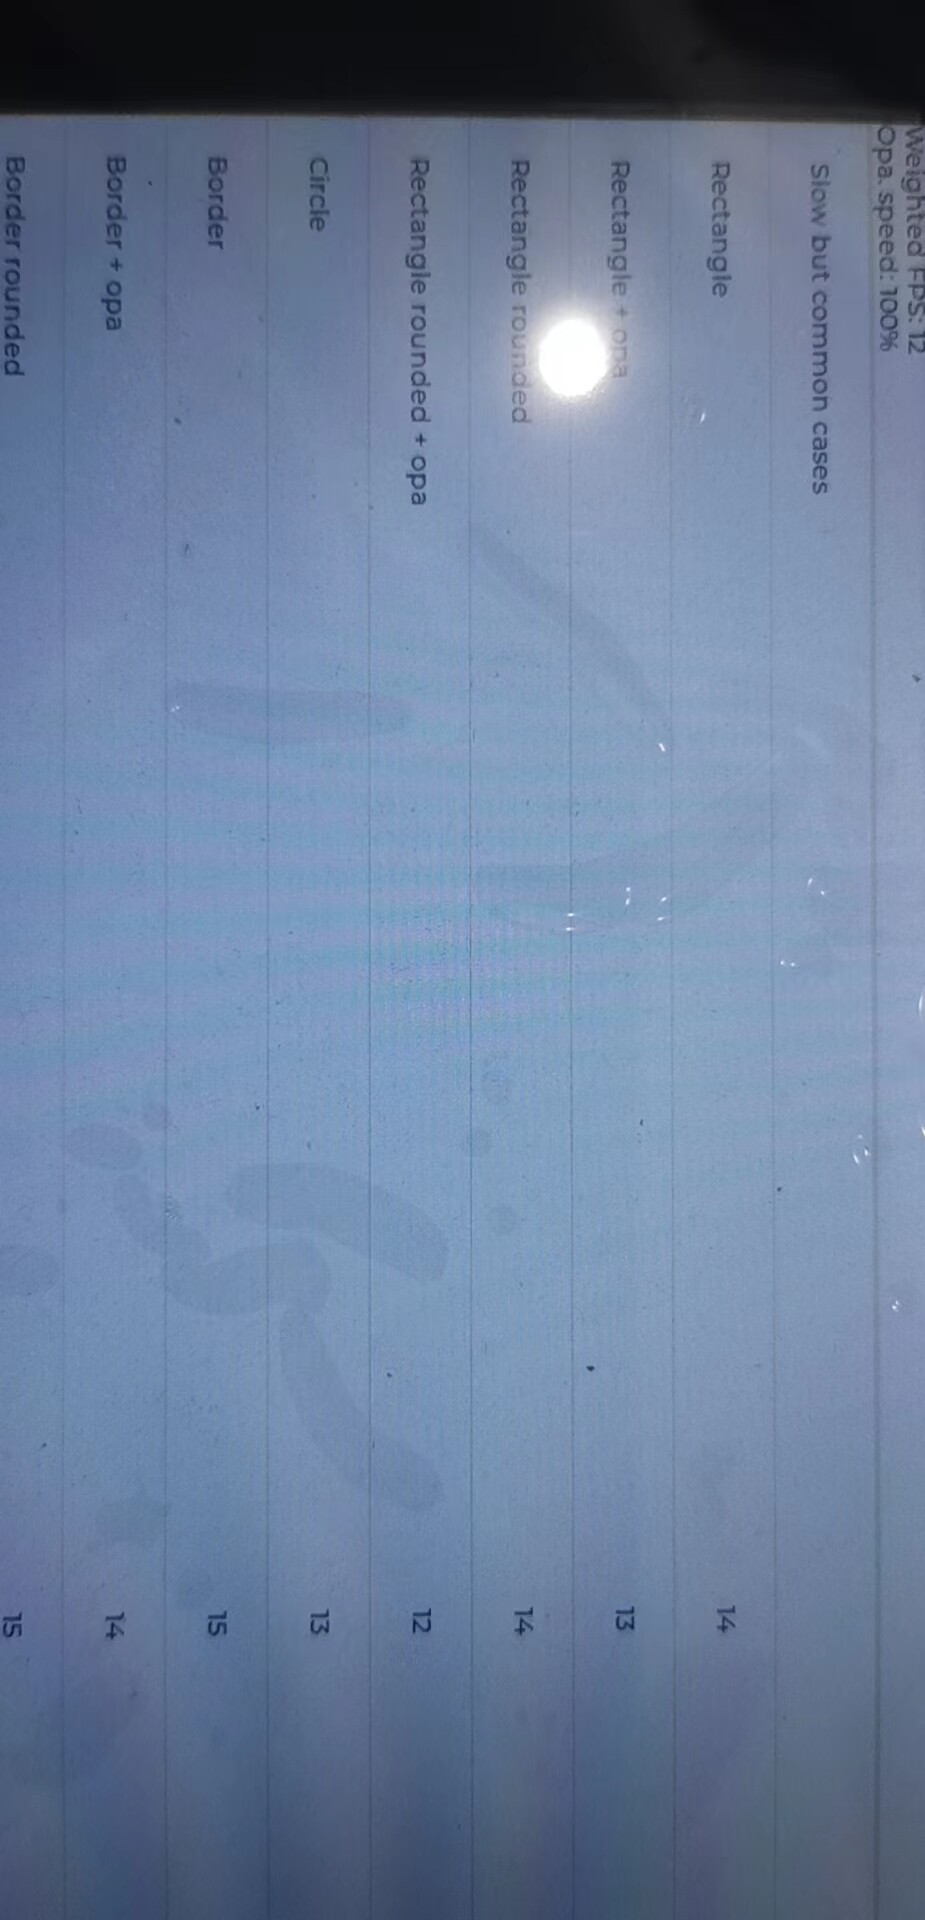
I have tired the new code but result almost the same. The rectangle score is still 14 vs 32 in single APP mode. Attached FYI.
Hi, @kisvegabor,
Many Thanks!
I have some problem on uploading the lvgl file and will try later. I just download the v8.2 last month and made no change on the lvgl file. I will try the latest one.
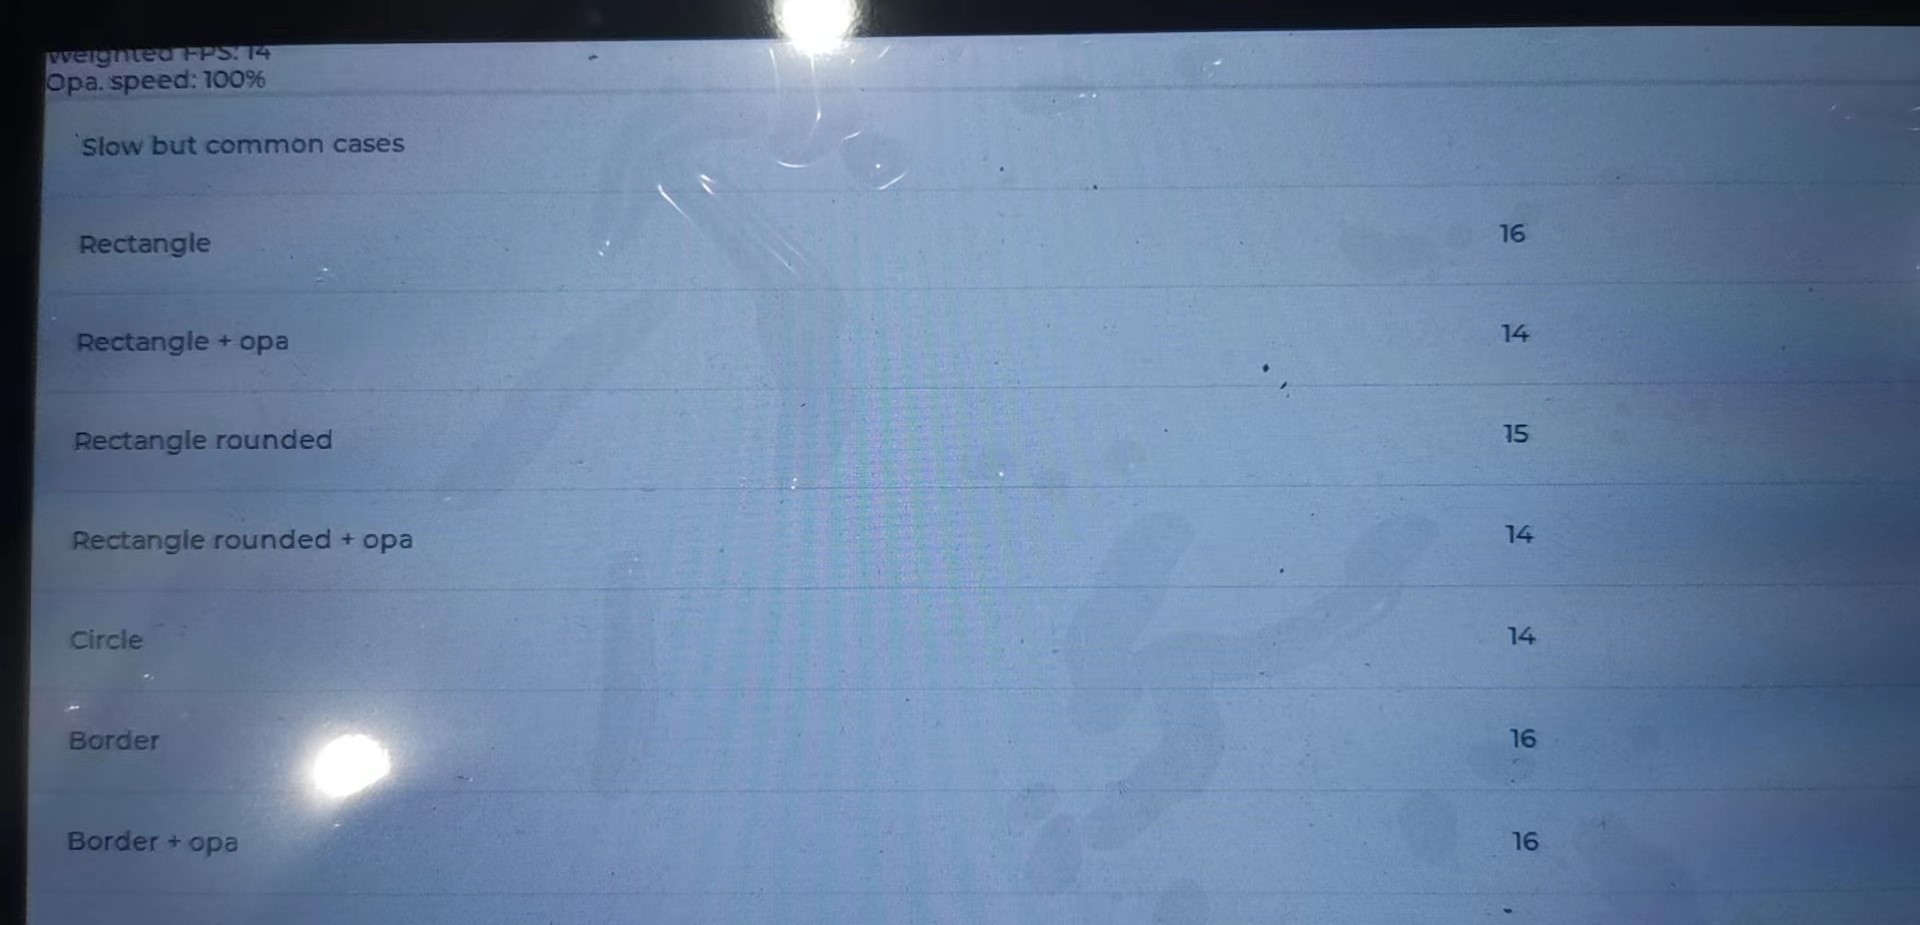
I just updated the newest master version 8.3 dev of lvgl lib and test again. The rectangle score is 16 in multi-APP condition vs 32 in single-APP condition. I also tried not to set the scene_bg cover and white, to let the background widget being drawn ,the score is also 16, same with the covered one. I doubt the background is always drawn regardless it is covered or not by the top widget container.
I also tried modifying the code on line 744-746 in lv_refr.c as your guide, the score is 15 , a little slower than the original one.
Would like to have your further advice.
Hi, @kisvegabor,
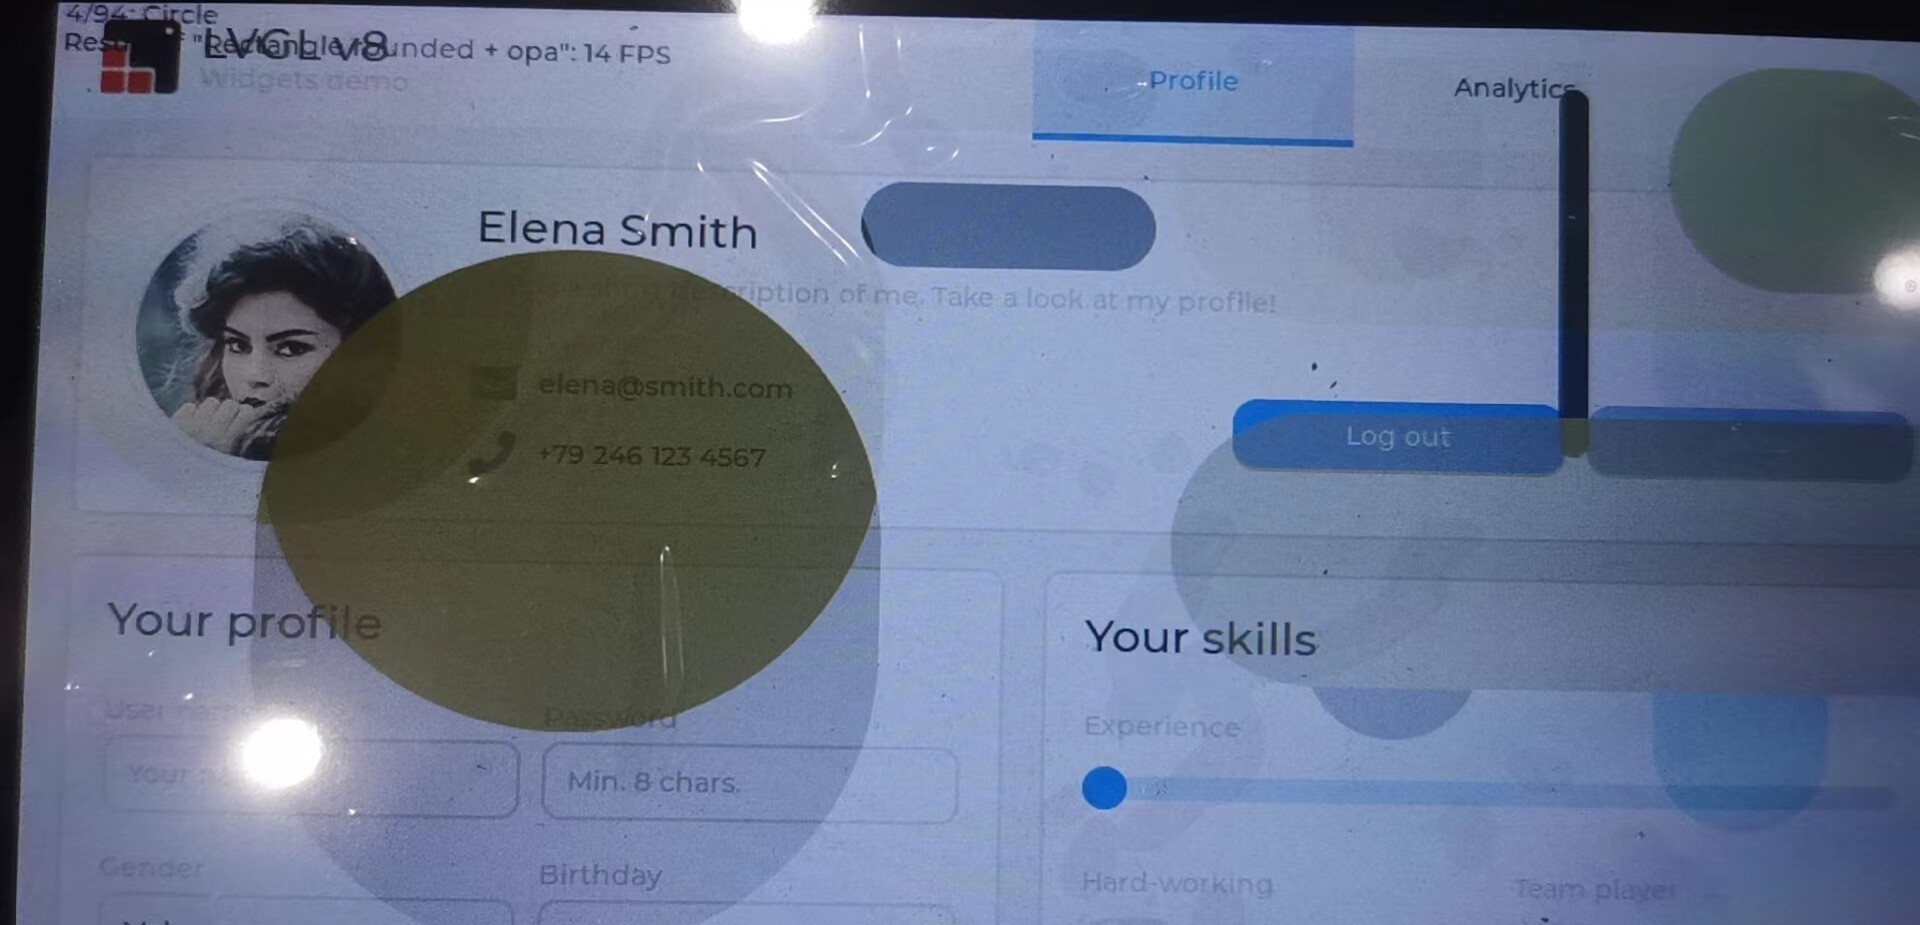
I found out that there have some part of the background tabview of the widget demo in the top area were not covered by the front benchmark demo scene_bg, please refer to the left and right cornor area in the attached photo. Is this the reason of full redrawn of the tabview widget and all its children, regardless if the children were covered by the top widget or not ?
It is not a good idea to redraw the children fully covered by the top widget, right? It seems the v7 have a different rule on the condition.
It can not cover the background widget demo, so the score drop to 15. And it is so easy to run to the hardfault status. Something is wrong when too much widget tree need refreshing with animation?
I am running the updated v8.3 dev version. Would you please help to check , if an object is partly covered by the top object, will all his child object be redrawn ,regardless of the child being fully covered or not by the top object in the V8.3 lib? I found that V7 will not redraw the child being covered but V8 will.
If a widget is covered by the top object, then that widget won’t be drawn. In other words if the top object covers something it means the top object over the other. And LVGL starts to draw from the top object so the object behind it will be untouched.
Don’t forget the bug I mentioned here, which affects whic object is found as top object.
Hi, @kisvegabor,
Many Thanks !
I doubt the background widget of the widget demo been fully redrawn when there just left a upper cornor area not being covered by the benchmark demo bg , as the frame rate droped from 32 to 16.
If not ,there should be a little drop of the frame rate comparing to the fully covered one.
Please refer to the last photo I post.
Would you please help to verify it.
Is there a serious performance drop in v8 (compared to v7) when running only the benchmark?
Is there a serious performance drop if you make the benchmark fully cover the widgets demo? (As described [here](https://Is there a serious performance drop in v8 (compared to v7) when running only the benchmark?))
Hi,@humphrey
I have stopped porting to v8 ,as the tight project timing at that time.
The issue is still there and I am coming back for the new v8.3.3, for many new feature there.
Hi, @kisvegabor ,
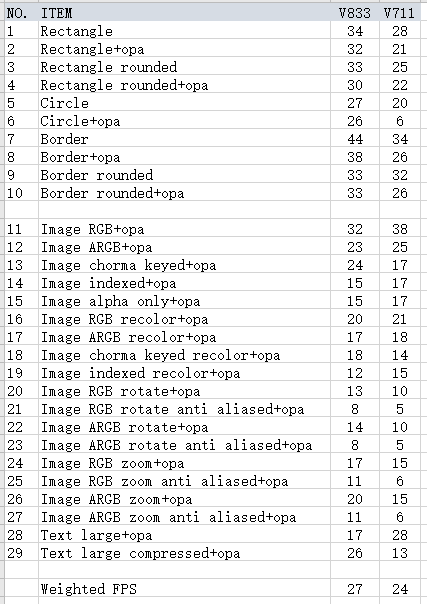
I went back to V8.3 for the more feature added these day. I have ported the V8.3 and V7.11 in the same platform , STM32H7 with 2 full size frame buffer in the SDRAM and running at the same clock. I had running in the direct mode and copy the dirty area by DMA2D. Everthing is fine.
Per my benchmark test , the V8.3 got higher weighted FPS ,the 27,than the V7.11, the 24. Please refer to the attached photo.
But in my test project , only a tabview with a list and some picture in the list button, when I scroll the list button , it looks obvious that the V7.11 have higher speed than the v8.3 in the scrolling.
Another test is a chart updated with the realtime waveform, and some marker and button on it. The measured FPS is 13 for V7.11 vs 9 for V8.3. When I move the marker on the waveform , both live FPS decreased , 11 for V7.11 and 6 for V8.3, much more performance down for the V8.3.
Could you help to find out the issues?
Hi, @kisvegabor ,
I am focussing on the chart drawing right now to find out if there have something could be optimized.
My chart is in the bar mode with 1012 point and update with the realtime waveform coming from the ADC, and there also have rectangle marker (not the cursor) and some button on it.
By tracking the code in the draw_series_bar of lv_chart_event, I found the colume is all drawn by the DMA2D and seems running normally. The measured FPS is 9 and will drop to 6 when I move the rectagle marker with the touch pannel , much more than the case of v7.11.
I am using the chart as the display of the oscilloscope or spectrum scope, so the refresh rate is the key parameter.
I am aware that the v8.3 is change to event callback instead of the design callback. Is there any way to
accelerate the speed of the chart drawing? I have set the style of the chart as below: