Description
What MCU/Processor/Board and compiler are you using?
STM32H7
What LVGL version are you using?
v8.2.0
What do you want to achieve?
speed up the V8 version comparable to the V7.11
What have you tried so far?
Test the benchmark both on V8.2 and V7.11
Code to reproduce
Hi, Team, @kisvegabor , @embeddedt
I recently port my APP from v7.11 to v8.2.0 and it works,but found extreme speed down to 0.5 fps where should be 10 fps in v7.11.
There have a scrollable tabview screen with icon on it when boot, and have a full screen img backgroud and 12 img button icon in each of the 2 tabview page…
My APP were created in the event cb of one icon button and based on an obj cover the whole background icon screen as the define below:
my_cont = lv_obj_create(lv_scr_act() );
lv_obj_move_foreground(my_cont );
lv_obj_clear_flag(my_cont , LV_OBJ_FLAG_CLICKABLE);
lv_obj_clear_flag(my_cont ,LV_OBJ_FLAG_SCROLLABLE );
lv_obj_set_size(my_cont , lv_pct(100), lv_pct(100));
lv_obj_set_scroll_snap_y(my_cont , LV_SCROLL_SNAP_CENTER);
lv_obj_set_style_border_width(my_cont , 0, 0);
lv_obj_set_style_pad_all(my_cont , 0, 0);
lv_obj_set_style_bg_color(my_cont , LV_COLOR_BLACK,0);
Note that the whole icon screen is still live but covered by the my_cont when my APP is running.
There have a chart and a canvas in my APP to display a realtime waveform capture from the ADC ,which should be the most costly widget, beside some buttons and labels. The chart and canvas are with 1024 point and cover the 2/3 of the screen and the TFT is 1024*600 resolution.
For comparable, I also replace my APP with the benchmark demo in place both in v7.11 and v8.2.0 and the rectangle score is 15 vs 8 in both case.
I also tried not to create the icon desktop and just run my benchmark in v8.2.0, the rectangle score rise to 60. It seems the icon desktop speed down the APP ,but there are just some button and img and lv_mem_monitor running there.
Any refresh rule changed from v7.11 to v8.2.0? How to speed up ? Would like to have your advice please!
Best Regards,
James
Hi,@pete-pjb,
Could you do me a favor? I learn you have also port the v7 to v8. Do you note the speed down?
Best Regards,
James
Hi,
Please attach your lv_conf.h. (as a file please, not copy pasting  )
)
Can you run a profiler to see what takes so long?
I con confirm that it’s not the normal behavior, v8 should be slightly faster then v7.
Hi @JamesJJ ,
I can confirm I have no performance issues with version 8.
Kind Regards,
Pete
cc @kisvegabor
Hi, @kisvegabor @pete-pjb,
lv_conf - forum.h (26.2 KB)
Many Thanks!
How to run the profiler ? Any guide?
Atttached are the file.
Best Regards,
James
Hi @JamesJJ ,
The only thing I have spotted which may or may not be an issue is the address:
LCD_FRAME_BUF_ADDR2 overlaps LV_MEM_ADR
So if you are using LCD_FRAME_BUF_ADDR2 for anything there is a high risk you are going to corrupt the lvgl heap memory.
Kind Regards,
Pete
1 Like
It should help with the profiler: Setting up Statistical Profiling in Atollic TrueSTUDIO - YouTube
It’s for Atollic not CubeIDE, but it’s quite the same.
Hi, @kisvegabor @pete-pjb,
Many Thanks!
The address define is not used in my code. I am using KEIL for debug and still in checking.
Is there any tool for KEIL to trace the code running?
Best Regards,
James
Hi @JamesJJ ,
I am not familiar with KEIL but their website shows some pretty comprehensive information should be available see here.
Kind Regards,
Pete
1 Like
Hi, @pete-pjb,
Many Thanks for kindly help!
I will learn to analysis with the KEIL’s tool by just a simple stlink , might take some time.
The v8 speed down issue is also reported by some engineer in local LVGL forum, comparing with the v7. I don’t think that is the issue from LVGL , but might be some detail driver or hardware related issue. Could you give some possible check point for it?
I have to mentioned again that I really detect the speed down in below case , which seems strange
1.For v8, only run the benchmark demo reach 60 score, but run it under a btn event cb of a tabview got 8 . The only different is the length of the widget tree.
2. Both run benchmark under a btn event cb of a tabview, v7 got 15 score and v8 got 8 .
I also have mention that as the MCU is stm32h750 , only a small flash on chip, most of the code were on the QSPI flash with catche enable. Some of the demo img were on the QSPI flash and most of them were on SDMMC and loaded to SDRAM when boot up. That all might be speed relative which I have to clearify.
Would like to have your further advice.
Best Regards,
James
Hi @JamesJJ ,
Can you share your lvgl initialisation code?
Are you using double buffering with DMA?
Have you seen this forum topic?
I initially had an issue with my hardware after porting to v8 as the full screen was being refreshed all the time. I used the methods detailed here to change my driver to just update the parts that had changed.
My initialisation code is:
	lv_init();
	lv_disp_drv_init((lv_disp_drv_t*)&cpu0_globals->gui.disp_drv);
	lv_disp_draw_buf_init(&cpu0_globals->gui.disp_buf, (void*)LV_VDB_ADR, (void*)LV_VDB2_ADR, (LV_HOR_RES_MAX*LV_VER_RES_MAX));
	cpu0_globals->gui.disp_drv.flush_cb = vga_disp_flush;
	cpu0_globals->gui.disp_drv.hor_res = LV_HOR_RES_MAX;                 /*Set the horizontal resolution in pixels*/
	cpu0_globals->gui.disp_drv.ver_res = LV_VER_RES_MAX;                 /*Set the vertical resolution in pixels*/
	cpu0_globals->gui.disp_drv.draw_buf = &cpu0_globals->gui.disp_buf;
	cpu0_globals->gui.disp_drv.full_refresh = pdFALSE;
	cpu0_globals->gui.disp_drv.direct_mode = pdTRUE;
	cpu0_globals->gui.disp = lv_disp_drv_register((lv_disp_drv_t*)&cpu0_globals->gui.disp_drv);
My flush call back and support functions are:
void vga_irq_handler( void *p ) {

	vga->vga_fbuf_addr = cpu0_globals->gui.dma_src;
	cpu0_globals->gui.buf_switched = pdTRUE;
	XScuGic_Disable(&xInterruptController, XPAR_FABRIC_VGA_IP_0_FRM_CPT_IRQ_INTR);
	lv_disp_flush_ready((lv_disp_drv_t*)&cpu0_globals->gui.disp_drv);
}

static void update_dual_buf( lv_disp_drv_t *disp_drv, const lv_area_t *area, lv_color_t *colour_p ) {

	lv_disp_t*	disp = _lv_refr_get_disp_refreshing();
	lv_coord_t	y, hres = lv_disp_get_hor_res(disp);
    uint16_t	a;
    lv_color_t	*buf_cpy;

    if( colour_p == disp_drv->draw_buf->buf1)
        buf_cpy = disp_drv->draw_buf->buf2;
    else
        buf_cpy = disp_drv->draw_buf->buf1;

    for(a = 0; a < disp->inv_p; a++) {
    	if(disp->inv_area_joined[a]) continue;
        lv_coord_t w = lv_area_get_width(&disp->inv_areas[a]);
        for(y = disp->inv_areas[a].y1; y <= disp->inv_areas[a].y2 && y < disp_drv->ver_res; y++) {
            memcpy(buf_cpy+(y * hres + disp->inv_areas[a].x1), colour_p+(y * hres + disp->inv_areas[a].x1), w * sizeof(lv_color_t));
        }
    }
}

void vga_disp_flush(lv_disp_drv_t *disp_drv, const lv_area_t *area, lv_color_t *colour_p) {

	static uint8_t	first_call = 1;

	if( first_call ) {
		cpu0_globals->gui.dma_src = (uint32_t)colour_p;
		first_call =  0;
		vga->total_pixels &= ~DMA_FIFO_RST; 	// Release Reset
		vga->total_pixels |= DMA_FRAME_READY;	// Start Proceedings
		vga->irq_reg = VGA_IRQ_EN;				// Enable DMA complete interrupt
	}
	if( lv_disp_flush_is_last( disp_drv ) ) {
		cpu0_globals->gui.dma_src = (uint32_t)colour_p;
		cpu0_globals->gui.buf_switched = pdFALSE;
		XScuGic_Enable(&xInterruptController, XPAR_FABRIC_VGA_IP_0_FRM_CPT_IRQ_INTR);
		while(!cpu0_globals->gui.buf_switched);// vTaskDelay(1);
		update_dual_buf(disp_drv, area, colour_p);
	}

	lv_disp_flush_ready( disp_drv );
}
This code is specific to my hardware but hopefully it gives you and idea of how it works.
I hope this helps.
Kind Regards,
Pete
1 Like
Hi, @pete-pjb,
Many Thanks indeed!
Yes I am running double buffering with DMA2D of stm32.
Per your link, I think that is the reason of extreme speed down in my project,as I set disp_drv.full_refresh = 1 in default. I was take that v8 is the same with v7 in this part.
I will follow your advice!
Best Regards,
James
Hi, @pete-pjb,
I have changed my code as your advice and it really works. The rectangle score of the benchmark demo rise from 8 to 12 and the refresh speed of my APP is close to the v7 ,but still a little slower, as the rectangle score is 15 in v7.
Could you help to verify in your side which is the faster in the benchmark demo comparing v7 and v8 in the true double frame buffer mode?
Attached for your information.
Best Regards,
James
Hi @JamesJJ
I am glad you are making progress!
I am sorry but I am not familiar with the benchmarks you are using. I have not ever used them.
May be we can ask @kisvegabor to provide you with this feedback.
Kind Regards,
Pete
1 Like
Hi, @pete-pjb,
Many Thanks for your kindly help!
The benchmarks demo is just from the LVGL file in the dir: lvgl-master\demos\benchmark . I am running it to evaluate the performance.
Best Regards,
James
1 Like
Hi, @kisvegabor,
I found out that the v7 will be a little faster than v8 in my full screen double frame buffer configuration with 1024*600 resolution . The refresh rate will slow down when the total widget increasing both in v7 and v8 ,but v8 is more serious.
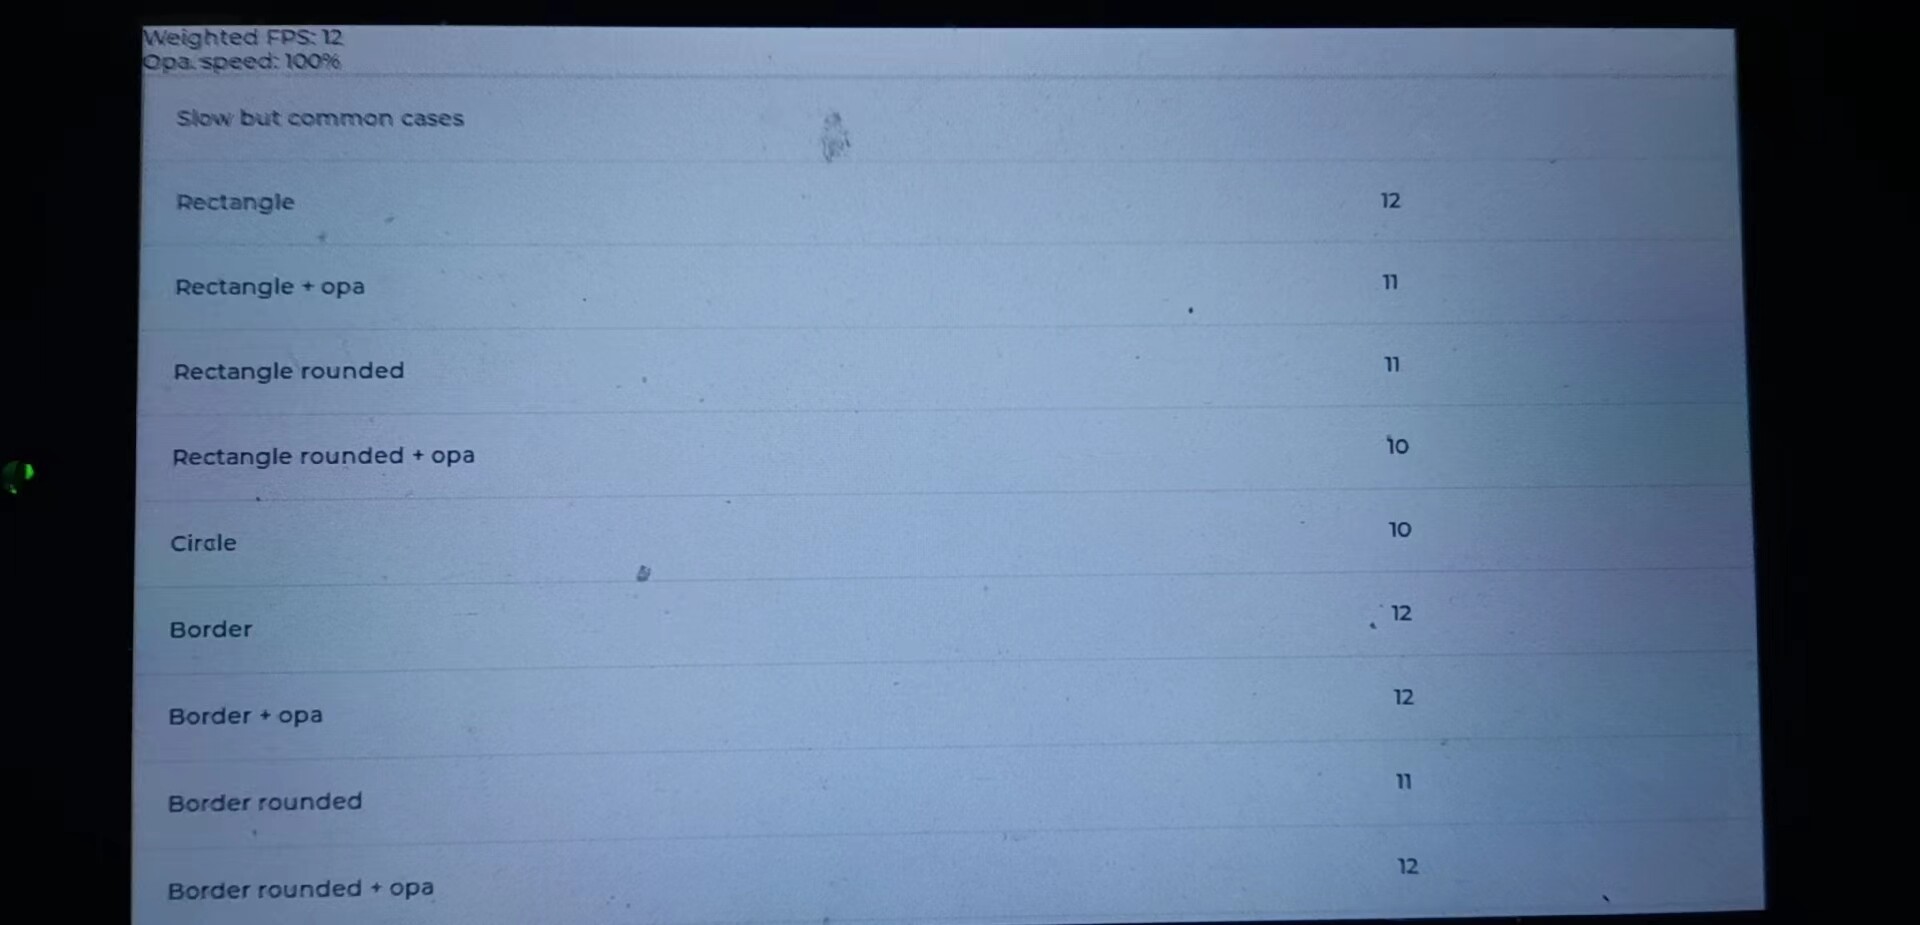
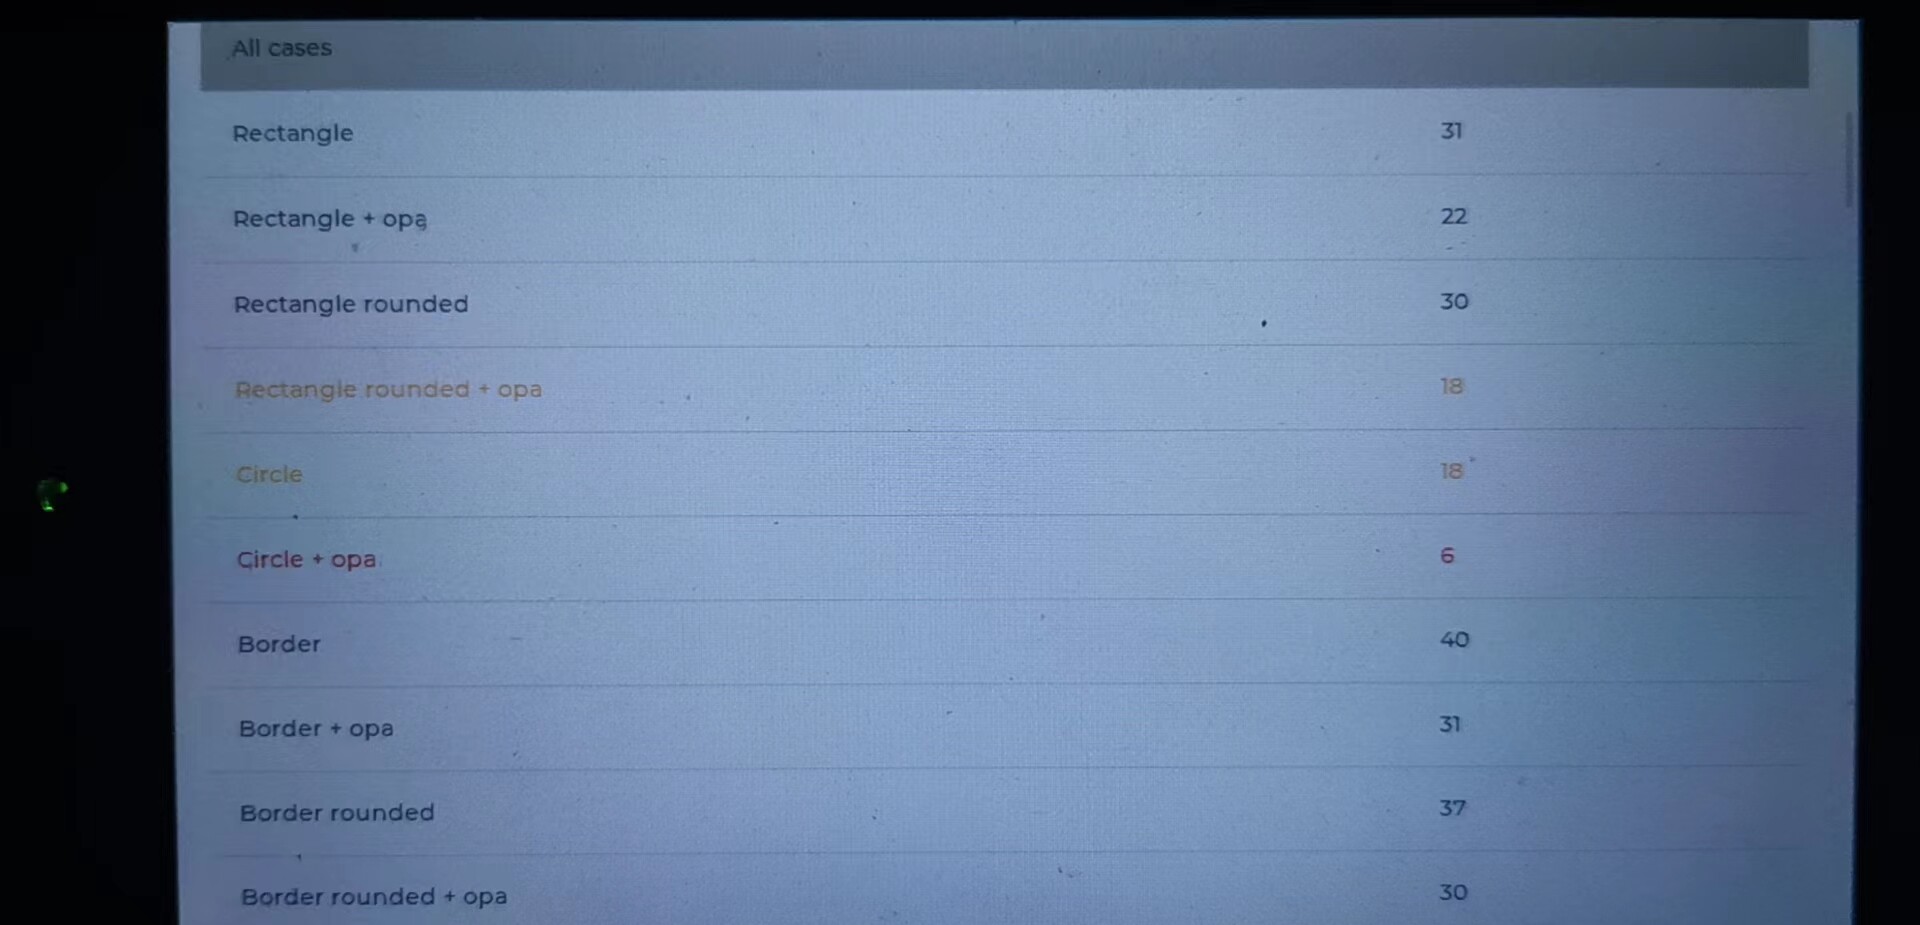
Attached are the result of benchmarks demo without other widget or APP running . The rectangle score is 31 in v7 and 30 in v8. As a comparison , in my photo in the above post, the benchmarks demo is running under a button event cb of the tabview and the score slow down to 15 for v7 and 12 for v8, nearly half of the original . The only different is the background widget tree adding , but it were covered by the benchmark container and will never being actually drawn .
Which might be the reason for the slow down and how to work around?
Best Regards,
James
It’s not the case for me in (at least in v8):
  lv_example_meter_1();
  lv_demo_benchmark();
Looks like this:
Are you sure all the compiler setting are the same? Mainly the optimization level.
1 Like
Hi, @kisvegabor and @pete-pjb,
I found a mistake in my benchmark testing in v7 that I forgot to set the background to COVER style. The background widget were drawn which slowing down the refresh rate. When setting as below, the rectangle score rise to 29 , very closed to the 31 of single APP conditions.
lv_obj_set_style_local_bg_color(scene_bg, LV_OBJ_PART_MAIN, LV_STATE_DEFAULT, lv_color_hex(0xffffff));
lv_obj_set_style_local_bg_opa(scene_bg, LV_OBJ_PART_MAIN, LV_STATE_DEFAULT, LV_OPA_COVER);
In v8 , I had already set the scene_bg in the last test and the rectangle score drop from 30 to 12 when in the multi-APP conditions. I will verify again.
Further more ,I found a very strange behavier in v8 that the DMA2D copy subrutine will mulfunction in the cb of disp_flush. If setting as below, the display is normal:
for(a = 0; a < disp->inv_p; a++) {
if(disp->inv_area_joined[a]) continue;
lv_coord_t w = lv_area_get_width(&disp->inv_areas[a]);
for(y = disp->inv_areas[a].y1; y <= disp->inv_areas[a].y2 && y < disp_drv->ver_res; y++) {
memcpy(buf_cpy+(y * hres + disp->inv_areas[a].x1), colour_p+(y * hres + disp->inv_areas[a].x1), w * sizeof(lv_color_t));
}
}
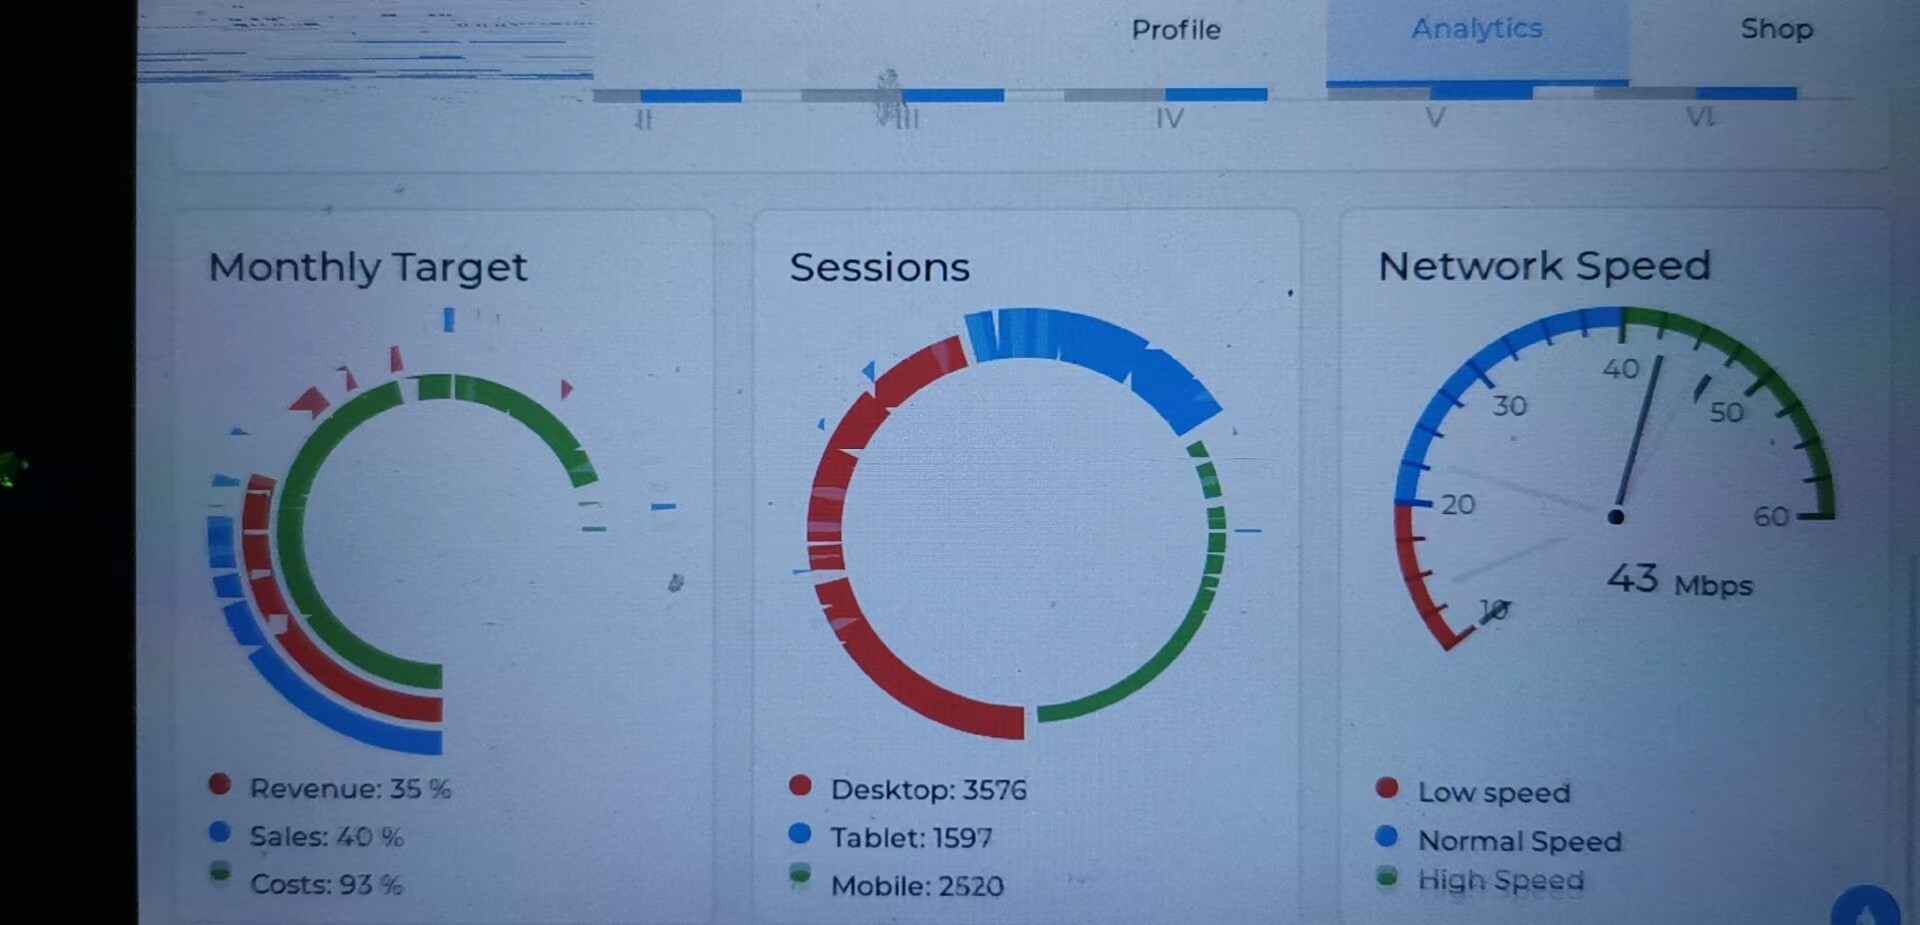
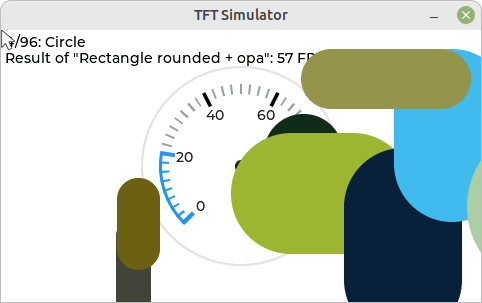
If changed to the DMA2D copy as below , the display will crash when in the animation of the the drawing as the attached photo. My own DMA2D copy is also like that.
int32_t act_x1 = disp->inv_areas[a].x1;
int32_t act_y1 = disp->inv_areas[a].y1;
int32_t act_y2 = disp->inv_areas[a].y2>disp_drv->ver_res?disp_drv->ver_res:disp->inv_areas[a].y2;
lv_coord_t h=act_y2-act_y1+1;
lv_draw_stm32_dma2d_buffer_copy(NULL,
buf_cpy, hres, &disp->inv_areas[a],
colour_p, hres, &disp->inv_areas[a]);
I am running on double frame buffer in the direct mode with manually copy the invalid area. The DMA2D copy function is correct in my v7 version .
Is there any reason for that issue of my v8 porting? That might be the same reason of the slow down in the multi-APP benchmark testing?
Best Regards,
James
Hi, @kisvegabor and @pete-pjb,
To verifying the slow down in multi-APP condition of v8 , I merged the lv_demo_widgets() with the lv_demo_benchmark() by setting the lv_demo_benchmark as the event cb of the log_out_btn as below
lv_obj_add_event_cb(log_out_btn, benchmark_event_cb, LV_EVENT_ALL, 0);
So when press the log_out_btn in the lv_demo_widgets demo, the benchmark demo is running now. As the background of the benchmark had been set to COVER and white, there should be no other widget drawing , but the rectangle score also drop to 12 comparing to the 30 in the single demo test, very similar with the score in my own tabview based multi-APP condition.
Could you help to verify it ?
Best Regards,
James
Hi, @kisvegabor and @pete-pjb,
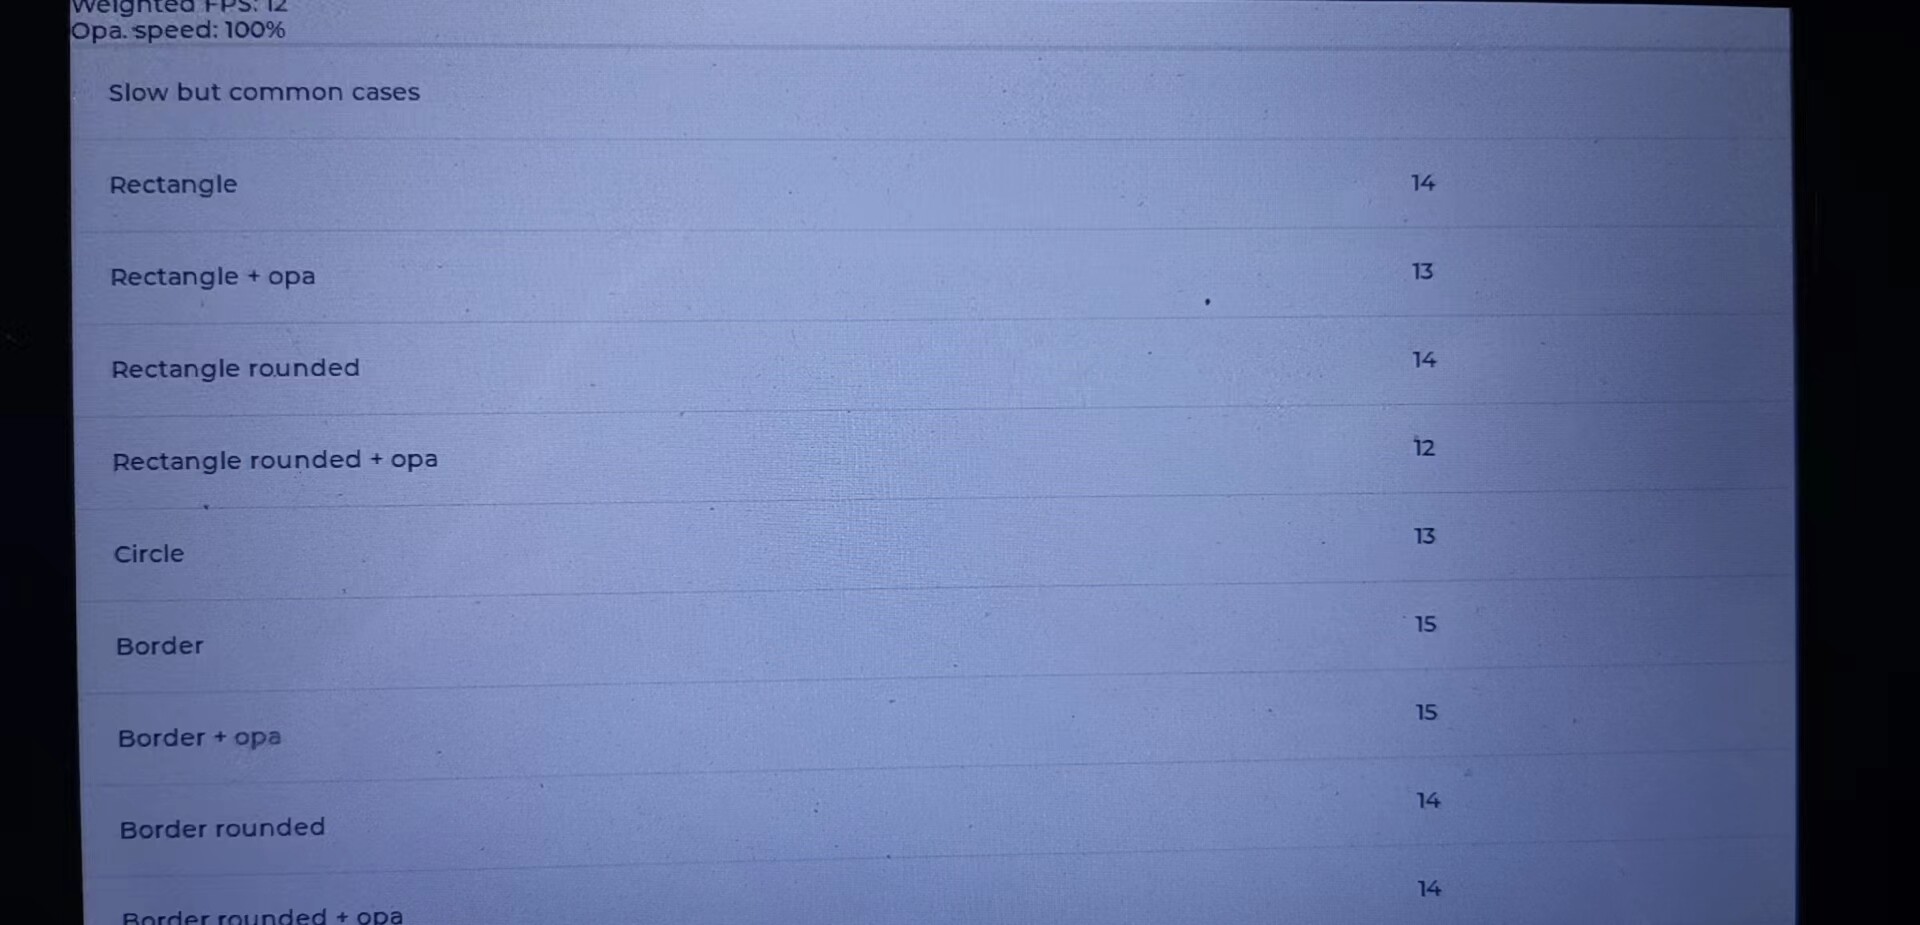
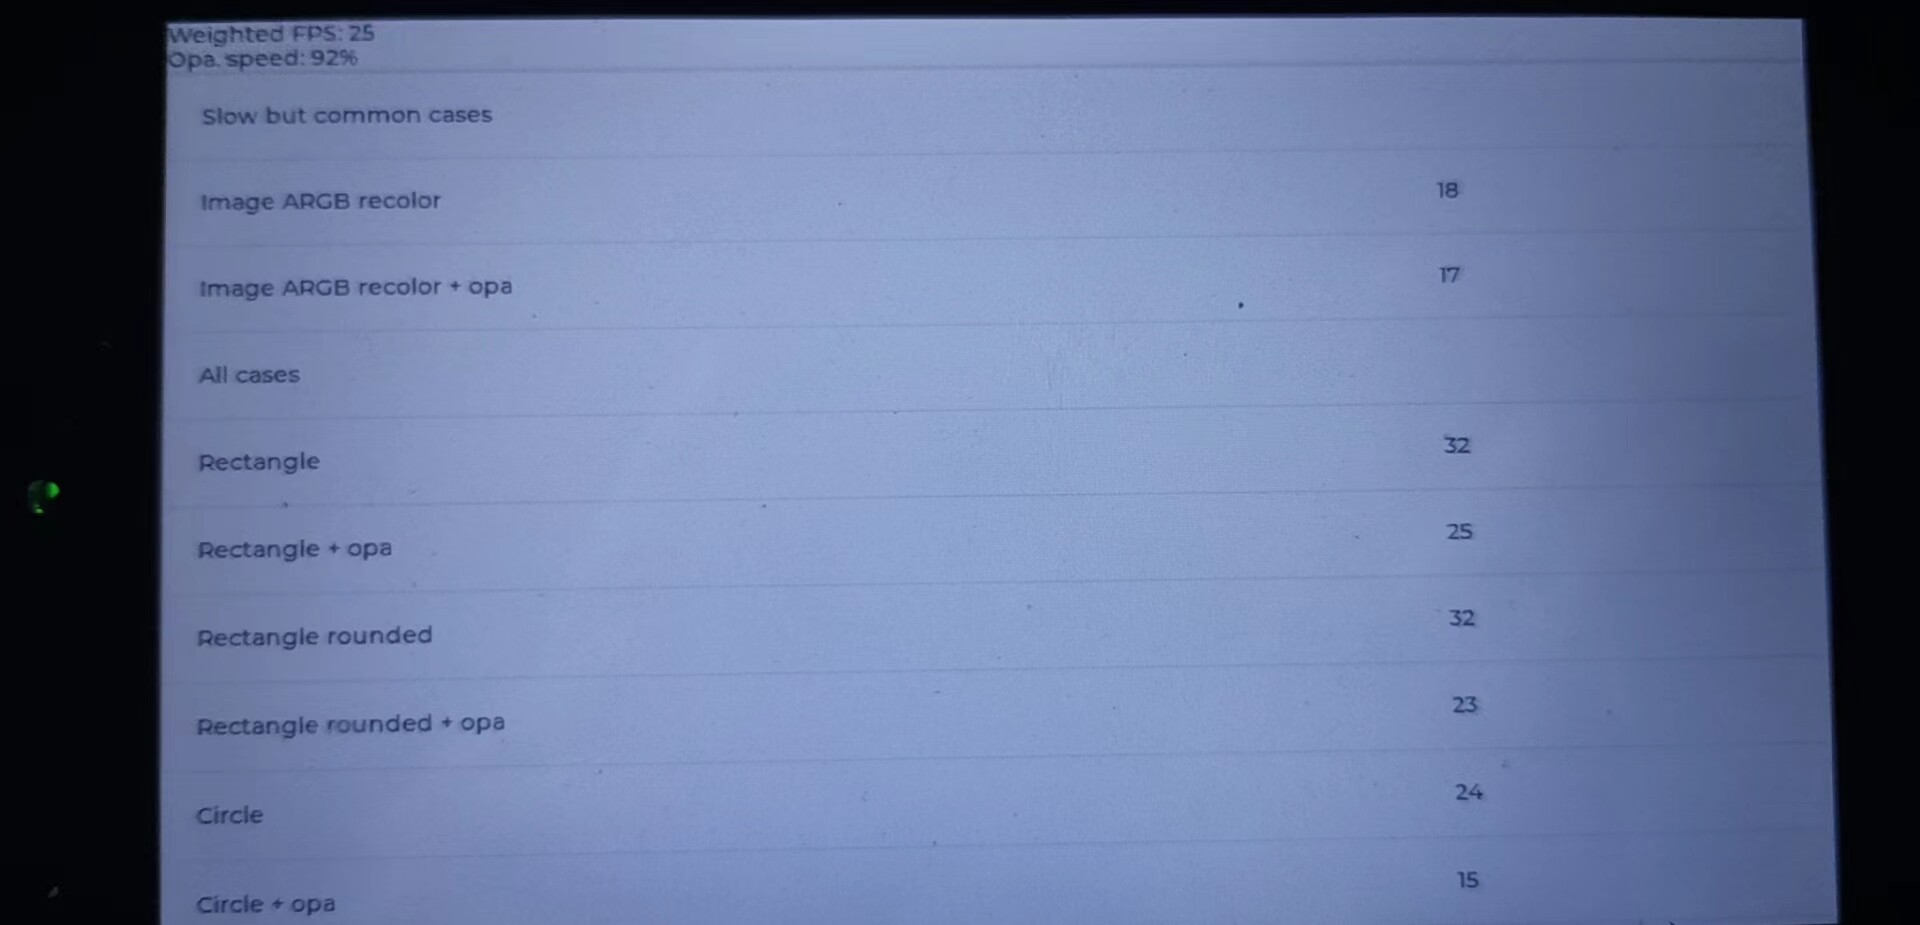
I have double confirmed that the score of rectangle will drop for 32 to 14 when switch from benchmark demo to widget+benchmark demo. There have not such issue in the v7 in the same test. Note that I have set the scene_bg of benchmark to cover and white, so nothing had been drawn in the background of the test.And I had bypass all the meter animation cb of the widget demo for not to interrupt the generate_report function of benchmark tes. Further note that I am running on double frame buffer in the direct mode with manually copy the invalid area by memcpy().
Would you please help to verify it?
Best Regards,
James