What is the logic behind lv_chart_set_axis_tick

Description

Currently I am trying to figure out how the lvgl chart works but the documentation is a bit unclear. My goal is to display logging data on the graph. The logging data is sampled as a float (in the background) every 30 seconds, stored in a ring buffer for 1 hour to be shown on the screen once the user chooses to show the graph.

For now I just have some random data loaded to display something (so no ring buffer, just 120 random values).

What MCU/Processor/Board and compiler are you using?

Simulator (Visual Studio)

What LVGL version are you using?

8.3…

What do you want to achieve?

The ideal graph should display the (floating point) data on the graph and auto-scale on the Y axis and on the X axis have a minor tick every 5 minutes and a major tick every 15 minutes with the time the sample was taken below the major tick.

What have you tried so far?

Different modifications of the sample but the documentation is a but unclear on how to correctly configure the axis tick(s). I did use lv_chart_set_point_count() already.

Until now I figured out the callback (check for type LV_CHART_DRAW_PART_TICK_LABEL and dsc->id == LV_CHART_AXIS_PRIMARY_X or LV_CHART_AXIS_PRIMARY_Y (once I want to display floating values))

However is is unclear to me how the dsc->value relates to the settings of void lv_chart_set_axis_tick(lv_obj_t *obj, lv_chart_axis_t axis, lv_coord_t major_len, lv_coord_t minor_len, lv_coord_t major_cnt, lv_coord_t minor_cnt, bool label_en, lv_coord_t draw_size) docs

Code to reproduce

Currently just the sample Axis ticks and labels with scrolling

Since an answer is taking a bit to long (no problems there by the way) I decided to just investigate myself. See this post as my notes/documentation for lv_chart_set_axis_tick and the callback event attached via lv_obj_add_event_cb(chart, DrawCallbackEvent, LV_EVENT_DRAW_PART_BEGIN, NULL);

The parameters major_len and minor_len. Although it seems obvious in hindsight it was initially a mystery (for me). These 2 are literally the length (in pixels) of the lines on the side of the graph.
Sample 1: major_len = 20, minor_len = 1
image
Sample 2: major_len = 10, minor_len = 10
image
Sample 3: major_len = 1, minor_len = 20 (don’t know why you would do this, but it is possible)
image

Next up the parameters major_cnt and minor_cnt. These 2 indicate the amount of ticks. The major_cnt indicates the total amount of ticks. The minor_cnt indicates the amount of ticks between the major ticks minus 1. Note that a minimum of 1 is required here. If minor_cnt = 0 no ticks are drawn. See also the source (8.3.10) if minor_cnt = 0, total_tick_num becomes 0. This caused the draw_._ticks() method to return early.

Sample 1: major_cnt = 10, minor_cnt = 0
image
Sample 2: major_cnt = 10, minor_cnt = 1
image
Sample 3: major_cnt = 20, minor_cnt = 3
image

The parameter label_en seems obvious, this enables/disables the label(s).
The final parameter draw_size is also unclear. However the documentation explains this better than I can.

Extra size required to draw the tick and labels (start with 20 px and increase if the ticks/labels are clipped)

Next up: The DrawCallbackEvent.
In the event we first get the draw descriptor pointer via lv_obj_draw_part_dsc_t* dsc = lv_event_get_draw_part_dsc(e);

From there we can check what type we are currently drawing. (See the source for the different types). In this case I’m only interested in LV_CHART_DRAW_PART_TICK_LABEL. We can filter for the type via this statement: lv_obj_draw_part_check_type(dsc, &lv_chart_class, LV_CHART_DRAW_PART_TICK_LABEL)

Next we can start filtering on the axis ID via dsc->id. The possible values here can be found in the source.

Next up, if we look at the source before the event callback

char buf[LV_CHART_LABEL_MAX_TEXT_LENGTH];
lv_snprintf(buf, sizeof(buf), "%" LV_PRId32, tick_value);
part_draw_dsc.label_dsc = &label_dsc;
part_draw_dsc.text = buf;
part_draw_dsc.text_length = LV_CHART_LABEL_MAX_TEXT_LENGTH;

lv_event_send(obj, LV_EVENT_DRAW_PART_BEGIN, &part_draw_dsc);

We can see that a buffer is created (of size 16) where the label is stored (temporarily). In the callback we get the opportunity to override this label.
The start of the buffer is at dsc->text. (Note: This callback is also done for minor ticks. However dsc->text is NULL at those moments.)
The length of the buffer can be found in dsc->text_length
Finally the dsc->value contains the current index being drawn. This is the (major) number you get at the axis if nothing else is being done.

Next post is for my scaling of the X and Y axis.

1 Like

So below (part of) my code to get the X and Y scaling the way I would like.
First the code to create the chart

//Create the chart
lv_obj_t* chart = lv_chart_create(parent);
lv_obj_set_align(chart, LV_ALIGN_CENTER);
lv_chart_set_type(chart, LV_CHART_TYPE_LINE);
lv_obj_set_size(chart, 400, 300);

//Set the axis
lv_chart_set_axis_tick(chart, LV_CHART_AXIS_PRIMARY_X, 10, 5, 5, 3, true, 50);
lv_chart_set_axis_tick(chart, LV_CHART_AXIS_PRIMARY_Y, 10, 5, 11, 1, true, 50);
lv_obj_set_style_size(chart, 0, LV_PART_INDICATOR);

//Generate some dummy data
float graphData[NUMBEROFSAMPLES];
for (size_t i = 0; i < NUMBEROFSAMPLES; i++)
{
	graphData[i] = lv_rand(0, 100)/50.0;
}

//Determine the maximum and minimum values
float minVal = 0;
float maxVal = 0;
for (int i = 0; i < NUMBEROFSAMPLES; i++) {
	if (graphData[i] < minVal) {
		minVal = graphData[i];
	}
	if (graphData[i] > maxVal) {
		maxVal = graphData[i];
	}
}

//ToDo: Determine the multiplier
int multiplier = 50;

//Convert the floats to integers
static lv_coord_t graphDataInt[NUMBEROFSAMPLES];
for (int i = 0; i < NUMBEROFSAMPLES; i++) {
   graphDataInt[i] = graphData[i] * multiplier;
}

//Set the Y range
lv_chart_set_range(chart, LV_CHART_AXIS_PRIMARY_Y, minVal * multiplier, maxVal * multiplier);

//Set the data
lv_chart_series_t* chartSeries = lv_chart_add_series(chart, lv_color_hex(0x808080), LV_CHART_AXIS_PRIMARY_Y);
lv_chart_set_ext_y_array(chart, chartSeries, graphDataInt);
lv_chart_set_point_count(chart, NUMBEROFSAMPLES);

//Set the event data
static EventData_t eventData;
eventData.multiplier = multiplier;
eventData.hour = 12;
eventData.min = 50;
eventData.sec = 10;

//Prepare the callback
lv_obj_add_event_cb(chart, DrawCallbackEvent, LV_EVENT_DRAW_PART_BEGIN, &eventData);

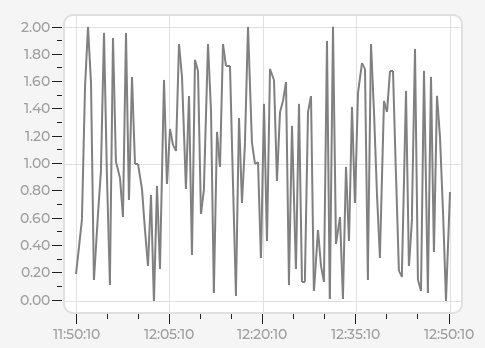
And next the callback (and yes, I know the way the X axis is done is not correct, but that is something I leave for the reader.

static void DrawCallbackEvent(lv_event_t* e)
{
    //Get the event descriptor
    lv_obj_draw_part_dsc_t* dsc = lv_event_get_draw_part_dsc(e);

    //Check what part we are updating. Only proceed if we are updating one of the tick label(s)
    if (!lv_obj_draw_part_check_type(dsc, &lv_chart_class, LV_CHART_DRAW_PART_TICK_LABEL))
        return;

    //Check this is a callback for a major tick (minor ticks have 0 here)
    if (dsc->text == NULL)
        return;

    //Get the multiplier from the user data
    EventData_t *eventData = (EventData_t*)lv_event_get_user_data(e);

    //If we are editing the Y axis
    if (dsc->id == LV_CHART_AXIS_PRIMARY_Y)
    {
        //update the label with the modified multiplier
        lv_snprintf(dsc->text, dsc->text_length, "%.2f", (float)dsc->value / eventData->multiplier);
    }
    else if (dsc->id == LV_CHART_AXIS_PRIMARY_X)
    {
        //ToDo: improve this logic
        switch (dsc->value)
        {
            case 0:
                lv_snprintf(dsc->text, dsc->text_length, "%02d:%02d:%02d", eventData->hour - 1, eventData->min, eventData->sec);
                break;
            case 1:
                lv_snprintf(dsc->text, dsc->text_length, "%02d:%02d:%02d", eventData->hour, eventData->min - 45, eventData->sec);
                break;
            case 2:
                lv_snprintf(dsc->text, dsc->text_length, "%02d:%02d:%02d", eventData->hour, eventData->min - 30, eventData->sec);
                break;
            case 3:
                lv_snprintf(dsc->text, dsc->text_length, "%02d:%02d:%02d", eventData->hour, eventData->min - 15, eventData->sec);
                break;
            case 4:
                lv_snprintf(dsc->text, dsc->text_length, "%02d:%02d:%02d", eventData->hour, eventData->min, eventData->sec);
                break;
        }
    }
}

And finally the result
image

1 Like