Important: unclear posts may not receive useful answers.
Before posting
- Get familiar with Markdown to format and structure your post
- Be sure to update lvgl from the latest version from the
masterbranch.- Be sure you have checked the relevant part of the documentation.
- If applicable use the Simulator to eliminate hardware related issues.
Delete this section if you read and applied the mentioned points.
Description
hi, I have some questions about chart line datas refresh.
I need a chart which is used to display large number of data, but the point size of the series is uncertain and needs to be set each time the page is displayed. So what I do is when first run in the timer, I set the point cnt to the series and bind the data group, and then begin to refresh the data.
the question is list below
1、after I zoomed the chart, I want to reset the chart show. How should I set? Just set the slider range and use lv_chart_set_x_start_point(chart, ser, 0)to draw the series from 1st point and without zoom?
2、in the chart_event_cb show below, it seems can’t show the the float format by lv_snprintf(buf, sizeof(buf), LV_SYMBOL_DUMMY"%f, %d", (float)id / 2, value_y);
3、how to modify and refresh the data, it seems without the commented code in the section_timer_event_cb it still refresh the series. It confused me.
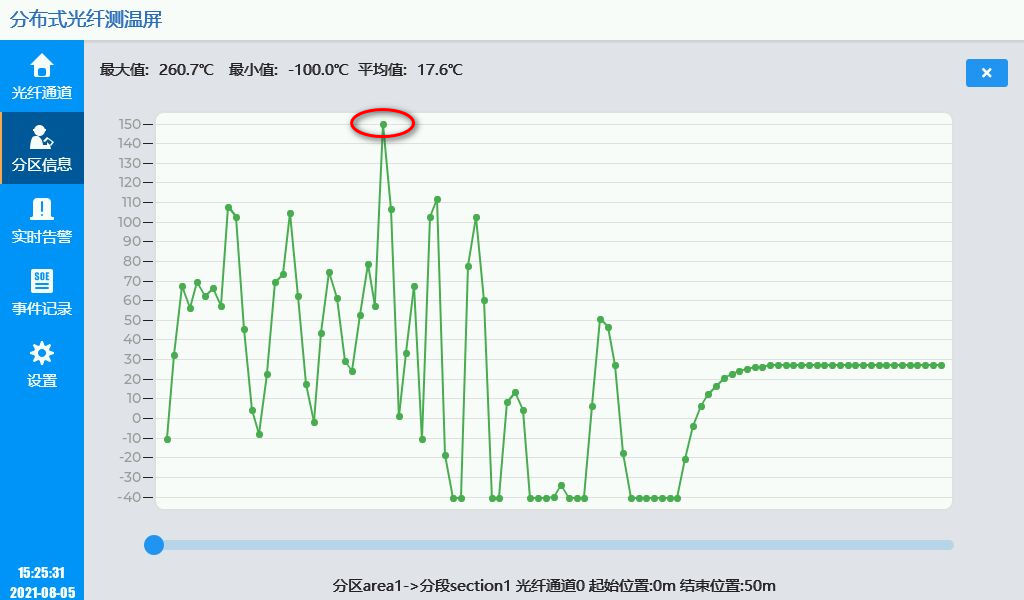
4、how to adjust the series point size? the point size seems a little big. the picture is show below.
What MCU/Processor/Board and compiler are you using?
arm335x
What LVGL version are you using?
8.0.1
What do you want to achieve?
What have you tried so far?
Code to reproduce
Add a code snippet which can run in the simulator. It should contain only the relevant code that compiles without errors when separated from your main code base.
The code block(s) should be formatted like:
static void section_timer_event_cb(lv_timer_t* timer)
{
uint32_t ch = s_sectionRun.chIdex;
uint16_t start = 2 * s_sectionRun.start;
uint16_t end = 2 * s_sectionRun.end;
uint16_t cnt = end - start + 1;
/* 获取分段的数据 */
getDTSChData_section(ch, &g_DTSDataPtr[ch], §ionData, start, end);
/* 获取该段需要的段数据 */
memset(g_DTSData[ch].data, 0, sizeof(g_DTSData[ch].data));
for (uint16_t i = 0; i < cnt; i++)
{
g_DTSData[ch].data[i] = 0;
if (g_DTSDataPtr[ch].TData)
g_DTSData[ch].data[i] = (int32_t)(*(g_DTSDataPtr[ch].TData + i + start));
g_DTSData[ch].data[i] = g_DTSData[ch].data[i] / 10;
if (g_DTSData[ch].data[i] > 150)
g_DTSData[ch].data[i] = 150;
if (g_DTSData[ch].data[i] < -40)
g_DTSData[ch].data[i] = - 40;
}
g_DTSData[ch].cnt = cnt;
/* when first run in the timer, set the point count of chart and bind the data array to the chart */
if (!s_sectionRun.firstEnter)
{
lv_chart_set_point_count(s_sectionObj.chart, g_DTSData[ch].cnt);
lv_chart_set_ext_y_array(s_sectionObj.chart, s_sectionObj.series, g_DTSData[ch].data);
s_sectionRun.firstEnter++;
return;
}
/* it necessary for us to update the chart line data? */
// for (int i = 0; i < cnt; i++)
// {
// s_sectionObj.series->y_points[i] = g_DTSData[ch].data[i];
// }
// lv_chart_refresh(s_sectionObj.chart);
}
static void chart_event_cb(lv_event_t* e)
{
lv_event_code_t code = lv_event_get_code(e);
lv_obj_t* chart = lv_event_get_target(e);
if (code == LV_EVENT_VALUE_CHANGED)
{
lv_obj_invalidate(chart);
}
if (code == LV_EVENT_REFR_EXT_DRAW_SIZE)
{
lv_coord_t* s = lv_event_get_param(e);
*s = LV_MAX(*s, 20);
}
else if (code == LV_EVENT_DRAW_POST_END)
{
int32_t id = lv_chart_get_pressed_point(chart);
if(id == LV_CHART_POINT_NONE) return;
lv_chart_series_t * ser = lv_chart_get_series_next(chart, NULL);
while(ser) {
lv_point_t p;
lv_chart_get_point_pos_by_id(chart, ser, id, &p);
lv_coord_t * y_array = lv_chart_get_y_array(chart, ser);
lv_coord_t value_y = y_array[id];
char buf[16];
/* it can't use the format float */
lv_snprintf(buf, sizeof(buf), LV_SYMBOL_DUMMY"%d, %d", id / 2, value_y);
lv_draw_rect_dsc_t draw_rect_dsc;
lv_draw_rect_dsc_init(&draw_rect_dsc);
draw_rect_dsc.bg_color = lv_color_black();
draw_rect_dsc.bg_opa = LV_OPA_50;
draw_rect_dsc.radius = 3;
draw_rect_dsc.bg_img_src = buf;
draw_rect_dsc.bg_img_recolor = lv_color_white();
lv_area_t a;
a.x1 = chart->coords.x1 + p.x - 40;
a.x2 = chart->coords.x1 + p.x + 40;
a.y1 = chart->coords.y1 + p.y - 30;
a.y2 = chart->coords.y1 + p.y - 10;
const lv_area_t * clip_area = lv_event_get_clip_area(e);
lv_draw_rect(&a, clip_area, &draw_rect_dsc);
ser = lv_chart_get_series_next(chart, ser);
}
}
else if (code == LV_EVENT_RELEASED)
{
lv_obj_invalidate(chart);
}
}
void main()
{
/* create chart */
lv_obj_t* chart = lv_chart_create(parent);
lv_obj_set_size(chart, 800, 400);
lv_obj_align_to(chart, NULL, LV_ALIGN_CENTER, 0, -10);
lv_chart_set_range(chart, LV_CHART_AXIS_PRIMARY_X, 1, 1000);
lv_chart_set_range(chart, LV_CHART_AXIS_PRIMARY_Y, -40, 150);
lv_chart_set_div_line_count(chart, 20, 0);
lv_obj_add_event_cb(chart, chart_event_cb, LV_EVENT_ALL, NULL);
/* set axis */
lv_chart_set_axis_tick(s_sectionObj.chart, LV_CHART_AXIS_PRIMARY_Y,
10, 5, 20, 1, true, 50);
/* add series */
lv_obj_t* series = lv_chart_add_series(chart,
lv_palette_main(LV_PALETTE_GREEN), LV_CHART_AXIS_PRIMARY_Y);
/* create slider */
slider = lv_slider_create(parent);
lv_slider_set_range(slider, LV_IMG_ZOOM_NONE, LV_IMG_ZOOM_NONE * 10);
lv_obj_add_event_cb(slider, slider_x_event_cb, LV_EVENT_VALUE_CHANGED, NULL);
lv_obj_set_size(slider, 800, 10);
lv_obj_align_to(slider, NULL, LV_ALIGN_BOTTOM_MID, 0, -50);
}
Screenshot and/or video
If possible, add screenshots and/or videos about the current state.