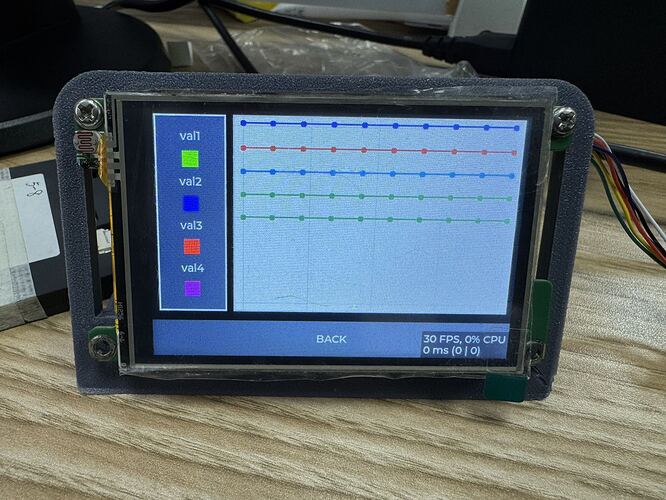
Description
i am receiving 5 values i would like to plot, the are for example val1 to val4 with one value representing the time stamp. All the four values have the same time stamp since they are received at the same time. I found the lv_chart that i tried using but the examples don’t really illustrate what i want to do. what i want is to plot the 4 values (y axis) and their time stamp( x axis).
What MCU/Processor/Board and compiler are you using?
i am using an esp32-s3 N16R8. I am writing the code in platformIO IDE with the Arduino framework
What LVGL version are you using?
the LGLV version is 9.1.0
What do you want to achieve?
i want the graph to be updated when the new values arrive and to shift them to the left as well as the axis just like any other graph.
some way to control the values of the x axis
What have you tried so far?
i have tried the LVGL chart widget, and from what i understood, the function lv_chart_set_next_value() only changes the y->points, as shown in the lv_chart.h fiel. I can display data on the graph but I don’t know how to access the x values.
Code to reproduce
Add a code snippet which can run in the simulator. It should contain only the relevant code that compiles without errors when separated from your main code base.
The code block(s) should be formatted like:
/*void add_data_to_chart(){

  lv_chart_series_t * ser1 = lv_chart_add_series(objects.data_graph, lv_palette_main(LV_PALETTE_GREEN), LV_CHART_AXIS_PRIMARY_Y);
  lv_chart_series_t * ser2 = lv_chart_add_series(objects.data_graph, lv_palette_main(LV_PALETTE_BLUE), LV_CHART_AXIS_PRIMARY_Y);
  lv_chart_series_t * ser3 = lv_chart_add_series(objects.data_graph, lv_palette_main(LV_PALETTE_RED), LV_CHART_AXIS_PRIMARY_Y);
  lv_chart_series_t * ser4 = lv_chart_add_series(objects.data_graph, lv_palette_main(LV_PALETTE_INDIGO), LV_CHART_AXIS_PRIMARY_Y);
  int32_t * ser2_y_points = lv_chart_get_y_array(objects.data_graph, ser2);

  uint32_t i;
  for(i = 0; i < 10; i++) {
    /*Set the next points on 'ser1'*/
    lv_chart_set_next_value(objects.data_graph, ser1, ui_val1);
    lv_chart_set_next_value(objects.data_graph, ser2, ui_val2);
    lv_chart_set_next_value(objects.data_graph, ser3, ui_val3);
    lv_chart_set_next_value(objects.data_graph, ser4, ui_val4);
  }

  lv_chart_refresh(objects.data_graph); /*Required after direct set*/
}*/
Screenshot and/or video
If possible, add screenshots and/or videos about the current state.
