I wanted to let you know that I have been working on this. it’s kind of a double project actually. I am hammering out bugs in the CPython LVGL binding I am writing at the same time. It’s one of the reasons why it is taking me longer. The API is closer to C then the MicroPython binding is so it is going to be a lot easier to port over to C code.
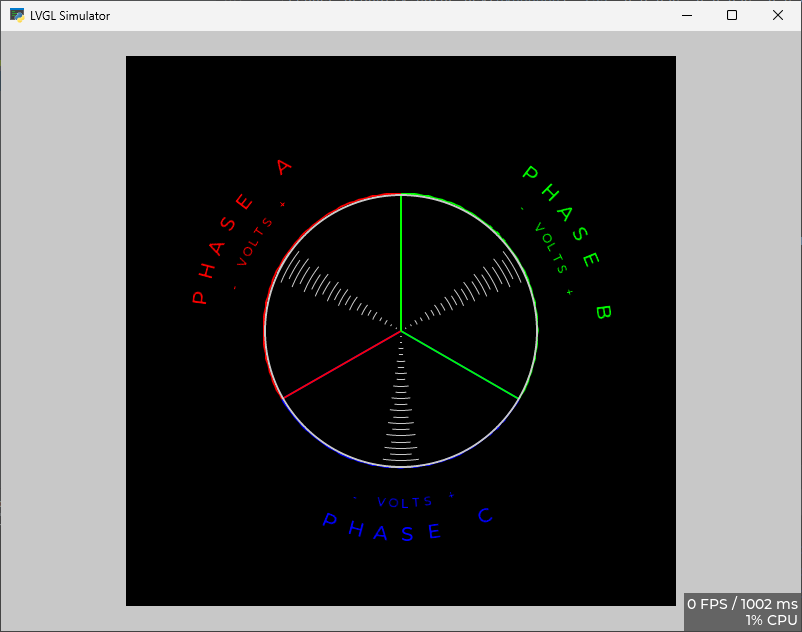
All of that is rendered, nothing used from an image. I have to draw in the “needle” for each phase…
With this code you have the ability to change the size of the graph as well as any of the fonts used, all of the colors, position.
I also put into it a little bit of a bonus. It will also graph voltage drop knowing what the voltage is at a < 5 amp current draw, what the current draw is and what the voltage reading is at that time. It will graph out the the drop up to 80% of the maximum scaled amps…