Description
Hi all, i would like to recreate a phasor diagram with LVGL, is it possibile? if so, how can i do it?
What MCU/Processor/Board and compiler are you using?
ESP32S3-WROOM1-N16R8 gcc 11 (esp-idf v5.0)
What LVGL version are you using?
8.2.0
What do you want to achieve?
Create a phasor diagram, as you can see on this image: phasor diagram
What have you tried so far?
I’ve seen that the the most similar thing to a phasor diagram is an lvgl chart, but it is not what i need.
Screenshot and/or video
You can see in this specific point of this video what i mean
phasor diagram
Does anyone have a solution to this?
Yes it can be done but it is not going to be simple to do. You will have to write your own bezier curve algorithm to make the waveform and you will have to add some functions to hammer out the circle math. what you want to do draw to the screen (if needing an alpha channel) or use lv_canvas. to render the waveform you are going to have to do that one pixel at a time.
I could write this in Python pretty easily. If you are able to port the code over to C I can help you out with this.
Sure, would be very helpful, i managed to create the graphs using classic graph, all i need to do is an easy method to draw vectors on the screen.
if you could give me an example of what the vectors are and draw up in a paint program what you are expecting it to look like when rendered to the screen would be easiest for me to understand what you exactly want.
You can see exactly what i want by looking at this youtube video, minute 1:52
Thank you for your help.
No worries about helping.
OK so what you want is not a waveform…
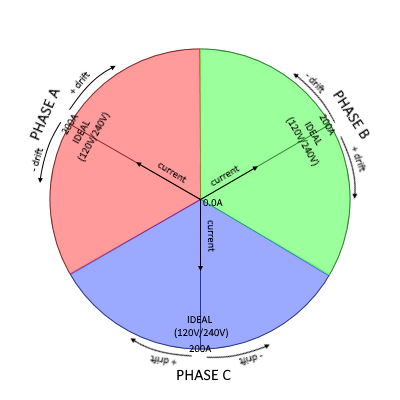
You want to be able to give a visual of what the voltage is for each phase relative to what the ideal voltage is and also show current draw on that phase at the same time…
That’s actually really easy to do. current draw is the radius from the center and voltage is the angle. the circle gets divided into 3 sections something like this.
several questions on this. do you want the values displayed at the point where the current and voltage intersect?
If hard coded scales are OK what is the scale for voltage and current?
Hard coded number of phases?
If hard coded number of phases is OK how many phases?
displaying of minimum and maximum values for the scales for each phase?
any special colors to be used or do you want hard coded colors?
I see you are using an ESP32. It is going to be easier for me to do this in Python. There is a MicroPython version of LVGL that will run on the ESP32. we can achieve C code speed for the calculations so there isn’t going to be much in the way of a performance hit. I also know how to override how LVGL handles refreshing the display so we will be able to get a better responsiveness out of it as well.
If you are OK with this being written in MicroPython I can give you the ability to control every single aspect of it, from colors to number of phases the ranges/scales. I can even add the ability to click on a specific phase to zoom into that phase or to change to an oscilloscope view of that phase that shows the AC waveform and also current.
I would be interested in knowing how you are doing the +120VAC to -120VAC (or 240VAC) conversion to the 0.1VDC to 2.6VDC that the ESP32 uses for the analog inputs. Really want to know how you are keeping the AC bounce from causing EMI on the DAC in the ESP32
Regarding the tools and EMI.
I read all the data from oscilloscope registers of QE-POWER-T, which is a power analyzer of three-phase power supply through RS485 MB RTU.
This is a video i made of my 10 inch TFT 1024x600 to help you understand what i’m doing, would be very useful if you could give me some tips to handle LVGL refresh for a better responsiveness.
Also, i use waveforms with analog discovery, as you can see from the video to simulate and test waves.
.
.
Regarding the code.
It would be nice to have it in micropython but i think i’ll have to write it down in c or maybe convert it in some way or make it work with my c code (i would need to search how to do it).
The fundamental thing i need to know is how to draw simple vectors from point A set on the screen (the origin) to point B (determined by an angle and the magnitude of the vector) or have some sort of widget to draw simple lines and vectors and how to make a circular graph like you saw with LVGL and C.
.
.
Regarding your questions.
Blockquote
do you want the values displayed at the point where the current and voltage intersect?
It is not important, as you can see on the video, they are printed at left.
Blockquote
If hard coded scales are OK what is the scale for voltage and current?
The scales are variable and automatically set by the max value + T, where T is the value needed to reach the next multiple of 10.
Blockquote
Hard coded number of phases?
If hard coded number of phases is OK how many phases?
The phases are always 3.
__
Blockquote
any special colors to be used or do you want hard coded colors?
Not particularly, but would be nice to have a choice on the colors.
Thank you for you help and your time!
I will code it in Python and you can convert it. I will put comments to tell you what is happening and what ctypes need to be used.
You are going to have to give me a few days on this OK?
Yes! Thank you for your help! Very very appreciated.
Is there a tool to convert from python to c? Also, the generated LVGL code from python still should be in c, right?
Do you have a method to do the conversion?
I sure do. the things at the end of your arms… LOL…
There is nothing really in the way of an automatic tool that would do the conversion. That is because Python is an object oriented language and variables to not have to have a type declared for them. Hence the reason why I said I would comment them to let you know what data type they are.
the syntax differences are not that hard to figure out. Python uses tabs where C uses {}. functions begin with “def” and in C they begin with the return type (I am going to put comments in to let you know what the return type is.
The underlying code for MicroPython is C code. There is a script that is included with the MicroPython binding called “gen.mpy.py” that can be run on the preprocessor output of C code and it will create a C source file that will be exposed to Python.
The nice thing about the design of MicroPython is it is an interpreted language which is compiled at runtime. Don’t think of the compile at runtime thing as how long it takes to compile most C code. It is actually pretty fast when it does it. The benifit to this is not having to recompile the project and do an upload of the firmware each time you change something. With Python you are able to upload the single source file you changed and simply restart the ESP32.
Another nice thing you can do is update your running program over WiFi really easily
MicroPython also supplies the user with a couple of tools to speed things up. These come in the form of what is called a function decorator. For integer math calculations and accessing GPIO pin registers you can use the viper code emitter which converts the Python code into machine code. This allows the function to run just as fast as compiled C code. Then you have the native code emitter which will work with python objects and floating point math. This provides a speed increase of about 6x, this comes at a cost of using more memory but if speed is extremely important then the tradeoff is worth it.
Another nice thing is you don’t have to focus on memory management too much. Python de-references objects when they go out of scope and it will de-allocate the use of memory when that happens. The thing you do have to keep track of is memory fragmentation just like with C code. and that is fairly easy to handle using pointers and declaring things that use a lot of memory right when the program starts. Also the creation of buffer objects and reusing them instead of making them over and over again.
I believe that what you need is not something that will be overly sensitive to speed. I think that for your intended purposes being able to pull a sample from a GPIO once every 0.01 seconds (100 Hz) is the most you would need. I could be wrong in that depending on what other goodies your project is able to sample. that speed is not an issue for MicroPython.
MicroPython for the ESP32 also supports threading. It is easy to use and I would use it to read the GPIOs and place the readings into a smoothing buffer and have the main thread that is running the GUI get the average of the buffer and set the readings into the GUI. a single lock/mutex would be needed for reading and writing to the buffers for the GPIO readings.

Thank you for all the explanation of micropython, the thing is that i wrote the whole code in c, so i think for this project i will continue in c.
Thank you for your help! Just message me when you have some news!
I wanted to let you know I have not forgotten about ya. I put in some time this evening working on this. I am spending more time writing documentation then writing code. The comments/docs are vital for being able to port it over to C code, this is magnified if you are unfamiliar with Python. I am explaining what is taking place for every single line just about.
Thank you man!! Very appreciated
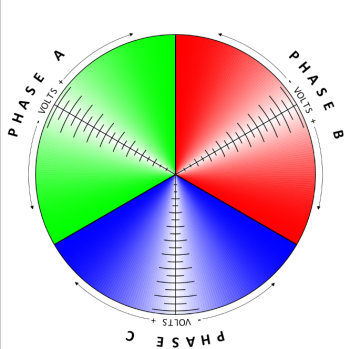
I am going to use this static image and then render the moving bits on top of it.
Is this good or are there any changes you want made? I can make it so that you can change the color of each section if you want, it is going to come at the cost of more memory use because a separate image with the gradient would have to exist. I am able to use the second image data for each of the phases I would just have to create an lv_obj_t structure for each of the phases and add the image data to it then rotate the image for 2 of them, one 120° and the second 240°.
I don’t know how much RAM or Flash storage you are working with. The image I am able to compact a pretty decent amount through a combination of resolution, bit depth and dithering. at a 600 x 600 resolution with 32 bit color and no dithering the file size is 264129 bytes. in ram that would take up 1440000 bytes. but if I change the resolution to 200 x 200 and save it as 8bit color with dithering the size ends up being 9629 bytes which takes up 80000 bytes of memory. There is a cost and that is image quality. If you can tell me what the resolution of the display is and also what the color depth of the display is I would be able to optimize the image to get the best balance between quality and RAM/Flash use.
Also. I have about 3/4rs of the code written. have to get the image into place and finish up the rest of the code and then I will test it out.
Thank you for your reply and your time.
Is there a method to not use an image? Like a background or drawing simple circle, it is because i need more control on the graph.
I think the best thing is do draw a simple circle and there is no matter for other UI apart from the colors which i could resolve by giving colors to the vectors.
So in substance: i would like to get rid of the image, draw a simple circle and color the vectors.
I would be able to render it all out but the gradient background would not be available. The other thing is it is going to be slower because it has to render it. to speed things up we would need to do the rendering using lv_canvas which has no support for an alpha channel. so what I would do is render the static portions of the gauge and then render the moving parts to the screen.
do you need this graph to be able to be scrolled? that adds in another layer of complexity to it because I have to set up events to watch for scrolling and to offset where the rendering to the display is taking place.
when you say color the vectors what do you mean by that?
I have no such memory in RAM to allocate for a single image, for the slowerness do not worry because the graph needs to be at max updated twice every second.
The graph does not need to be scrolled or touched, it is simply 6 vectors moving on a circle, that change over modbus queried data, so as simple as it can be.
By color the vectors i mean to literally give different color to the vectors at my choice: so if i want a vector of a color i should be able to specify it with some method.
Thank you for your help and your time! You are very kind.
when you say vector you mean a graphed line where the end furthest from the center of the circle represents current draw and voltage simultaneously the voltage is the angle of the line within a 120° range and the current is now far from the center the end of the line is.
Correct??
I have most of the code finished up and I am going to be testing it within the next few days. I have a lot of stuff I have to get done at home before the wife gets home from her trip. Trying to wrap up some construction type projects I am working on.
