static char time_strings[13][6];
static const char* time = {
time_strings[0], time_strings[1], time_strings[2], time_strings[3],
time_strings[4], time_strings[5], time_strings[6], time_strings[7],
time_strings[8], time_strings[9], time_strings[10], time_strings[11], NULL
};
static void add_data(lv_timer_t* t)
{
lv_obj_t* scale_bottom = lv_timer_get_user_data(t);
static int hour_offset = 0;
hour_offset = (hour_offset + 1) % 24;

for (int i = 0; i < 12; i++) {
    int hour = (i + hour_offset) % 24;
    snprintf(time_strings[i], sizeof(time_strings[i]), "%02d:00", hour);
}

lv_scale_set_text_src(scale_bottom, time);
}
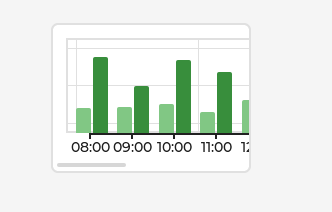
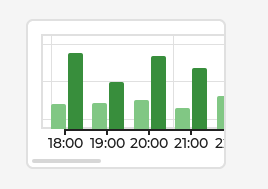
void lv_example_chart_2(void)
{
/Create a container/
lv_obj_t* main_cont = lv_obj_create(lv_screen_active());
lv_obj_set_size(main_cont, 200, 150);
lv_obj_center(main_cont);
/*Create a transparent wrapper for the chart and the scale.
 *Set a large width, to make it scrollable on the main container*/
lv_obj_t* wrapper = lv_obj_create(main_cont);
lv_obj_remove_style_all(wrapper);
lv_obj_set_size(wrapper, lv_pct(300), lv_pct(100));
lv_obj_set_flex_flow(wrapper, LV_FLEX_FLOW_COLUMN);

/*Create a chart on the wrapper
 *Set it's width to 100% to fill the large wrapper*/
lv_obj_t* chart = lv_chart_create(wrapper);
lv_obj_set_width(chart, lv_pct(100));
lv_obj_set_flex_grow(chart, 1);
lv_chart_set_type(chart, LV_CHART_TYPE_BAR);
lv_chart_set_range(chart, LV_CHART_AXIS_PRIMARY_Y, 0, 100);
lv_chart_set_range(chart, LV_CHART_AXIS_SECONDARY_Y, 0, 400);
lv_chart_set_point_count(chart, 12);
lv_obj_set_style_radius(chart, 0, 0);


/*Create a scale also with 100% width*/
lv_obj_t* scale_bottom = lv_scale_create(wrapper);
lv_scale_set_mode(scale_bottom, LV_SCALE_MODE_HORIZONTAL_BOTTOM);
lv_obj_set_size(scale_bottom, lv_pct(100), 25);
lv_scale_set_total_tick_count(scale_bottom, 12);
lv_scale_set_major_tick_every(scale_bottom, 1);
lv_obj_set_style_pad_hor(scale_bottom, lv_chart_get_first_point_center_offset(chart), 0);

for (int i = 0; i < 12; i++) {
    int hour = i;
    snprintf(time_strings[i], sizeof(time_strings[i]), "%02d:00", hour);
}

lv_scale_set_text_src(scale_bottom, time);
lv_timer_create(add_data, 1000, scale_bottom);
/*Add two data series*/
lv_chart_series_t* ser1 = lv_chart_add_series(chart, lv_palette_lighten(LV_PALETTE_GREEN, 2), LV_CHART_AXIS_PRIMARY_Y);
lv_chart_series_t* ser2 = lv_chart_add_series(chart, lv_palette_darken(LV_PALETTE_GREEN, 2), LV_CHART_AXIS_PRIMARY_Y);

/*Set the next points on 'ser1'*/
uint32_t i;
for (i = 0; i < 12; i++) {
    lv_chart_set_next_value(chart, ser1, lv_rand(10, 60));
    lv_chart_set_next_value(chart, ser2, lv_rand(50, 90));
}
lv_chart_refresh(chart); /*Required after direct set*/
}