Description
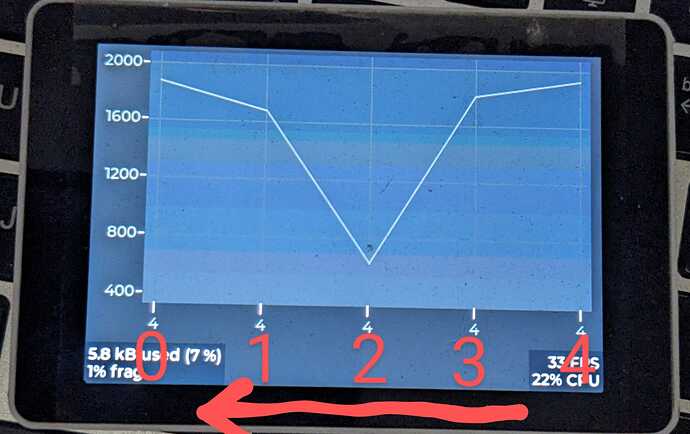
I would like to dynamically update chart X-Axis labels.
What MCU/Processor/Board and compiler are you using?
Arduino ESP-32
What LVGL version are you using?
LVGL Version 8.2
What do you want to achieve?
On chart X-Axis, I have 5 major ticks and i want to updates their label dynamically. I should be like a time series chart, where older time stamps are moved to left and new timestamps are added to right side.
What have you tried so far?
I followed example and added a event to chart, and tried to update the labels. but it seems all ticks labels are being update to same value when I set them.
Code to reproduce
/*globals*/
uint32_t time_T = 0;
static lv_obj_t *ui_Screen1;
static lv_obj_t *ui_Chart1;
static lv_chart_series_t *ui_Chart1_series_1;

/*Task to update chart */
  while (1) {

    int data = random(400, 2000);
    time_T = xTaskGetTickCount() / 1000;
    lv_chart_set_next_value(ui_Chart1, ui_Chart1_series_1, data);
    vTaskDelay(1000 / portTICK_PERIOD_MS);

  }

/*ui chart*/
void lv_example_chart_2(void)
{


  ui_Chart1 = lv_chart_create(lv_scr_act());
  lv_obj_set_width( ui_Chart1, 420);
  lv_obj_set_height( ui_Chart1, 240);
  lv_obj_set_x( ui_Chart1, -10 );
  lv_obj_set_y( ui_Chart1, 5 );
  lv_obj_set_align( ui_Chart1, LV_ALIGN_TOP_RIGHT );
  lv_chart_set_type( ui_Chart1, LV_CHART_TYPE_LINE);
  lv_chart_set_point_count( ui_Chart1, SAMPLE_SIZE);
  lv_chart_set_range( ui_Chart1, LV_CHART_AXIS_PRIMARY_Y, 400, 2000);
  lv_chart_set_div_line_count( ui_Chart1, 5, 5);

  /*lv_chart_set_axis_tick(chart,    axis,   major_len, minor_len, major_cnt, minor_cnt, label_en, draw_size)*/
  lv_chart_set_axis_tick( ui_Chart1, LV_CHART_AXIS_PRIMARY_X, 10, 0, SAMPLE_SIZE, 2, true, 25);
  lv_chart_set_axis_tick( ui_Chart1, LV_CHART_AXIS_PRIMARY_Y, 5, 0, 5, 2, true, 50);
  lv_chart_set_axis_tick( ui_Chart1, LV_CHART_AXIS_SECONDARY_Y, 0, 0, 0, 1, false, 25);

  ui_Chart1_series_1 = lv_chart_add_series(ui_Chart1, lv_color_hex(0x808080), LV_CHART_AXIS_PRIMARY_Y);
  lv_obj_set_style_radius(ui_Chart1, 0, LV_PART_MAIN | LV_STATE_DEFAULT);
  lv_obj_set_style_bg_color(ui_Chart1, lv_color_hex(0x345989), LV_PART_MAIN | LV_STATE_DEFAULT );
  lv_obj_set_style_bg_opa(ui_Chart1, 50, LV_PART_MAIN | LV_STATE_DEFAULT);
  lv_obj_set_style_bg_grad_color(ui_Chart1, lv_color_hex(0x8EA7C8), LV_PART_MAIN | LV_STATE_DEFAULT );
  lv_obj_set_style_bg_grad_dir(ui_Chart1, LV_GRAD_DIR_VER, LV_PART_MAIN | LV_STATE_DEFAULT);
  lv_obj_set_style_border_width(ui_Chart1, 0, LV_PART_MAIN | LV_STATE_DEFAULT);

  lv_obj_set_style_line_width(ui_Chart1, 1, LV_PART_ITEMS | LV_STATE_DEFAULT);
  lv_obj_set_style_size(ui_Chart1, 0, LV_PART_INDICATOR | LV_STATE_DEFAULT);
  lv_obj_set_style_line_width(ui_Chart1, 1, LV_PART_TICKS | LV_STATE_DEFAULT);

  lv_obj_add_event_cb(ui_Chart1, chart_event_cb, LV_EVENT_ALL, NULL);

}

/*Call-back*/
static void chart_event_cb(lv_event_t * e)
{

  lv_event_code_t code = lv_event_get_code(e);
  if (code == LV_EVENT_DRAW_PART_BEGIN) {

    lv_obj_draw_part_dsc_t * dsc = (lv_obj_draw_part_dsc_t*) lv_event_get_param(e);
    if (dsc->part == LV_PART_TICKS && dsc->id == LV_CHART_AXIS_PRIMARY_X) {
      lv_snprintf(dsc->text, sizeof(dsc->text), "%lu", time_T);
    }
  }

}
