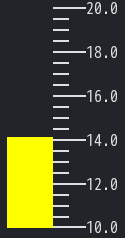
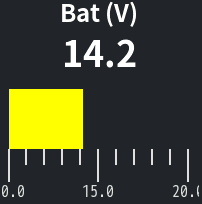
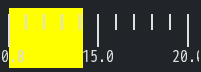
This is like the linemeter except it is linear, not curved. Sorry about the name but I was working in the existing names.
Coupled with a bar it serves as a labeled axis. The chart has some similar logic.
With a bar and label it makes a display
The code below will not work unless you add the define to lv_conv.h. And you should update the themes too.
But I wanted to post this here to see if it was worth incorporating into the main code. Probably it needs a couple of style attributes added, like tick ratios.
Is it general enough? Will it be used by a decent number of people?
The features need to planned carefully to make easy to use, light and versatile. Besides a docs page and examples need to be created. This part mainly depend on whether @xennex as time and interest to discuss it and improve the widget is needed.