Hello folks,
I am seeking some help editing the contents of a bar chart at runtime in LVGL 8.3.11.
Here is the plotting function:
void drawAutoScaledBarGraph(uint8_t numOfBars, int values[], String xTicks[]) {

  lv_chart_series_t* ui_mainGraph_series_1 = lv_chart_add_series(ui_mainGraph, lv_color_hex(0x686868), LV_CHART_AXIS_PRIMARY_Y);

  // Count the number of non-zero values
  int nonZeroCount = 0;
  for (int i = 0; i < numOfBars; i++) {
    if (values[i] > 0) {
      nonZeroCount++;
    }
  }

  // Dynamically allocate memory for the series array
  lv_coord_t* ui_mainGraph_series_1_array = new lv_coord_t[nonZeroCount];

  // Loop through each bar and draw it only if the value is greater than 0
  int drawnBars = 0;
  for (int i = 0; i < numOfBars; i++) {
    if (values[i] > 0 && values[i] < 60) {
      ui_mainGraph_series_1_array[drawnBars] = values[i];
      drawnBars++;
    }
  }

  lv_chart_set_axis_tick(ui_mainGraph, LV_CHART_AXIS_PRIMARY_X, 10, 0, drawnBars, 1, true, 50);
  lv_chart_set_ext_y_array(ui_mainGraph, ui_mainGraph_series_1, ui_mainGraph_series_1_array);

  // Print the number of drawn bars
  Serial.print("Drawn Bars:\t");
  Serial.println(drawnBars);
}
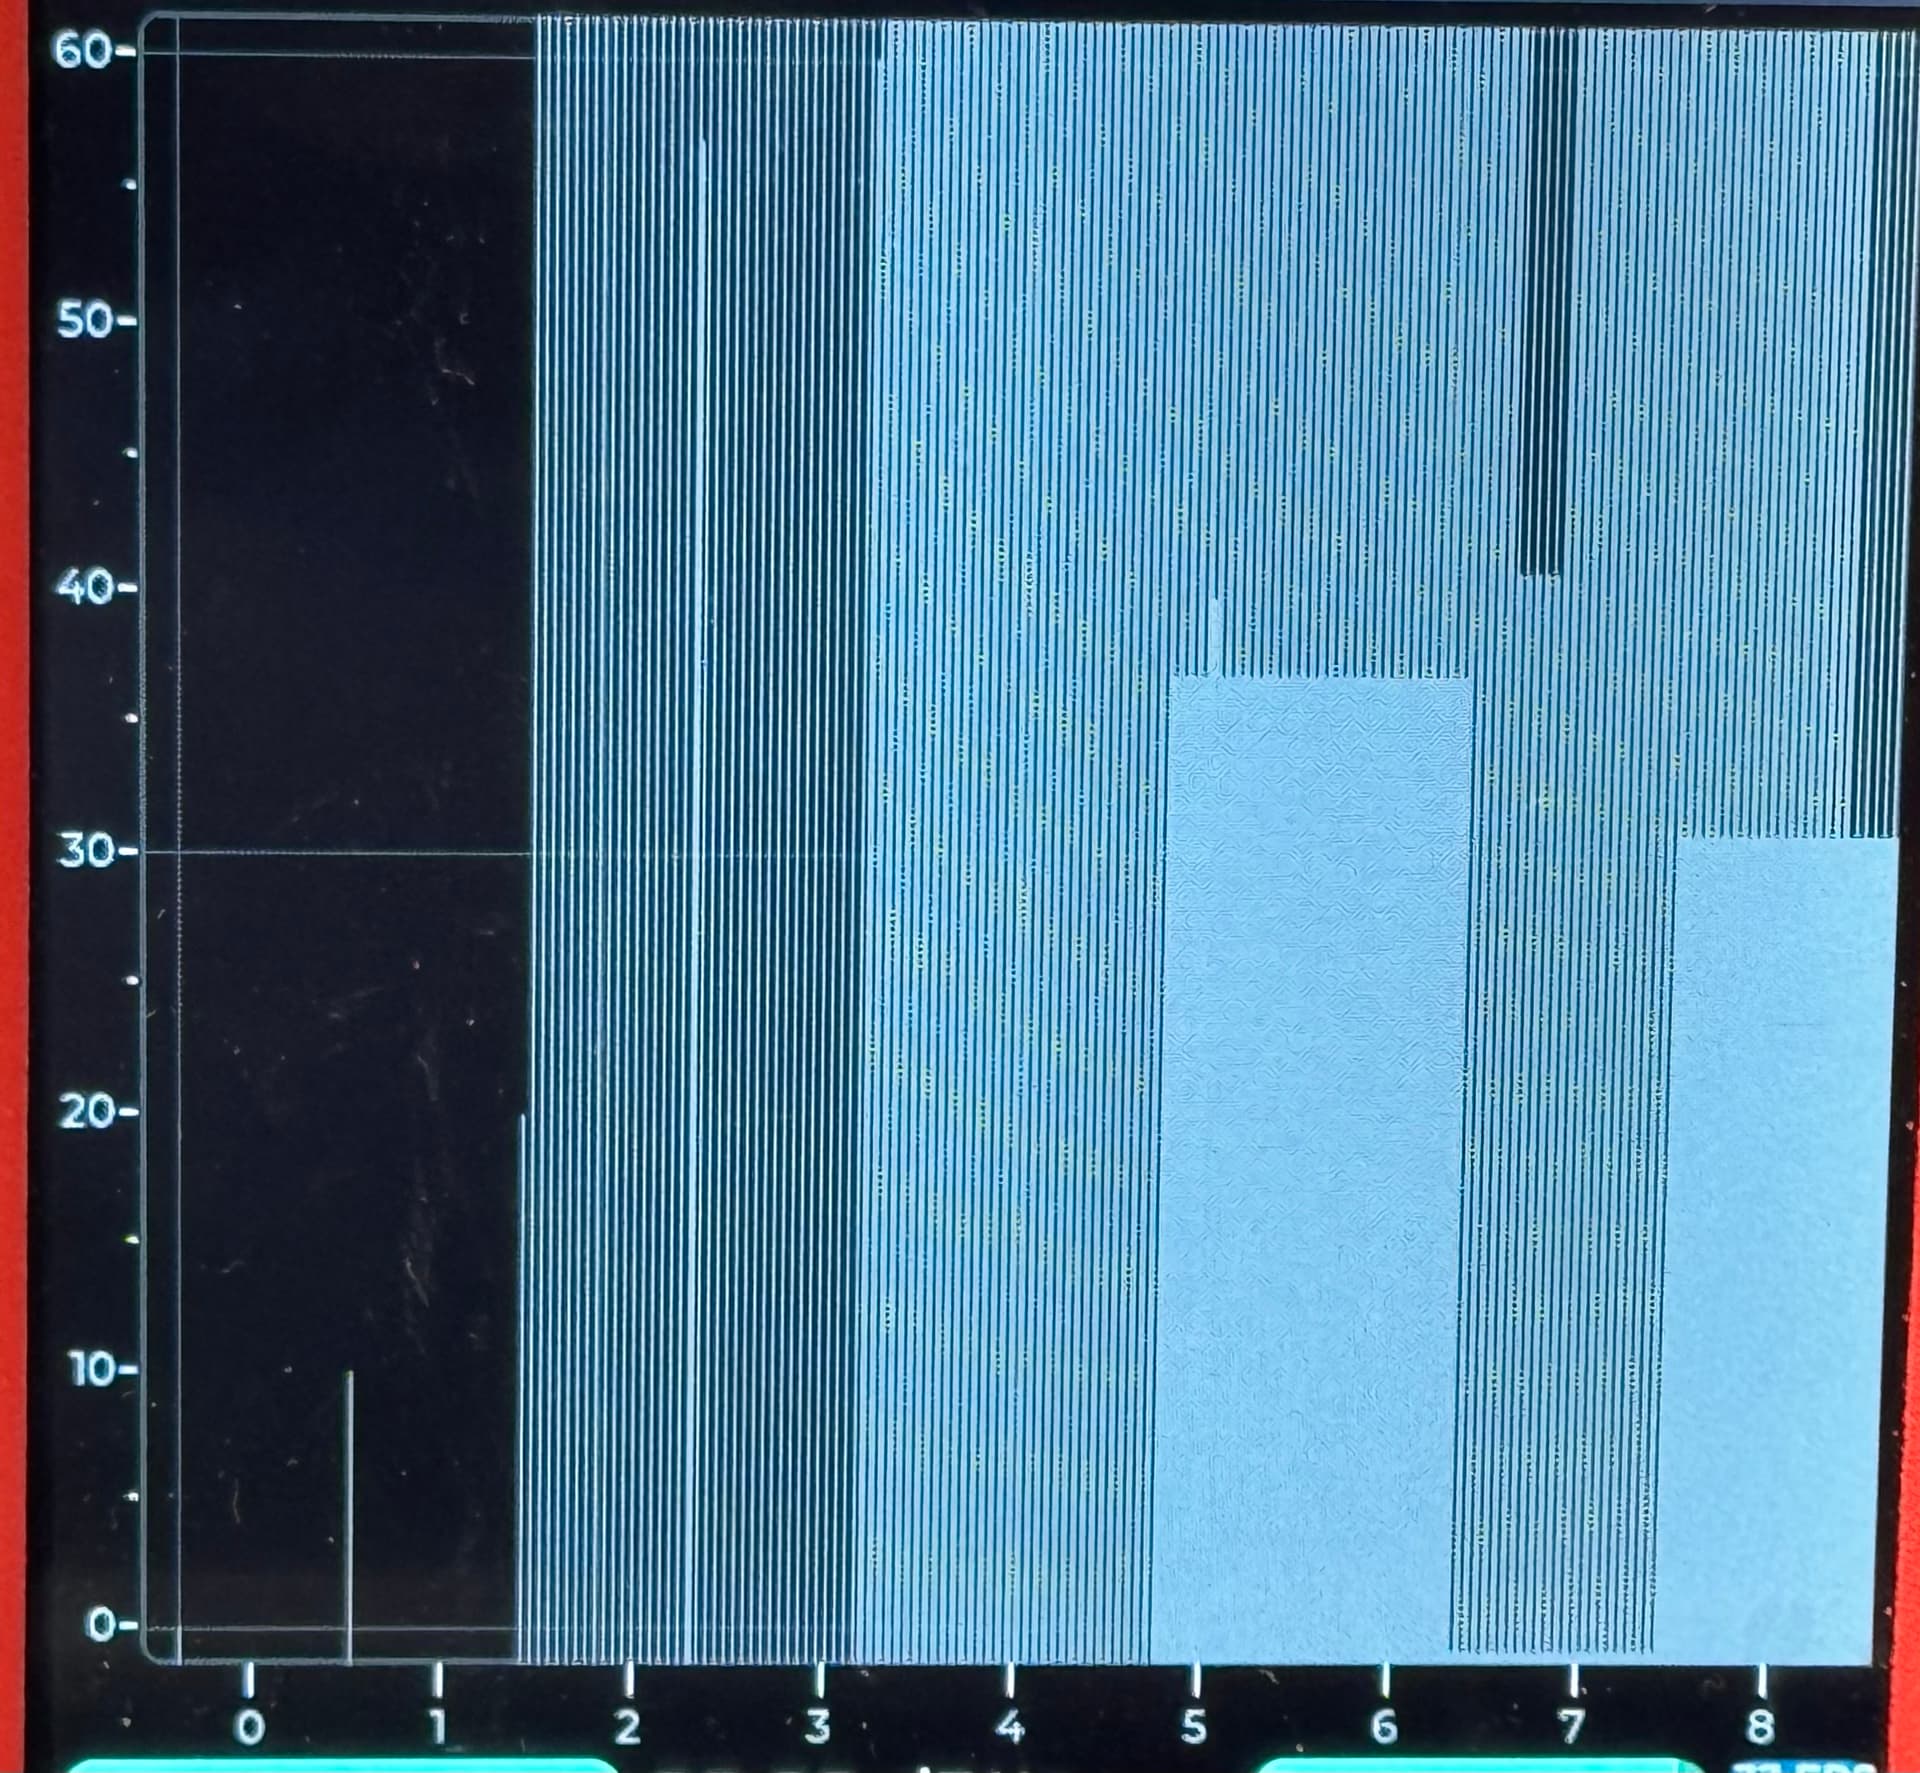
The expectation is to see a bar chart with number of bars matching the count in drawnBars.
However, this is the result. Looks like multiple bars are drawn in clusters at each “xtick”