Description
Hi guys.
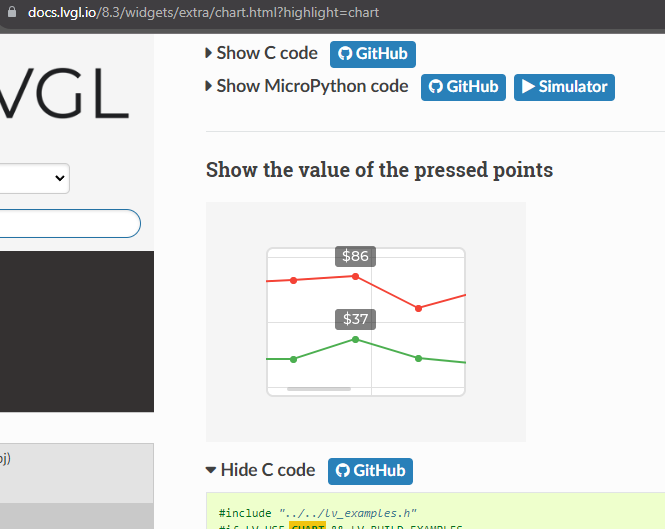
I have modified the lv_example_chart_4 example from Chart (lv_chart) — LVGL documentation,
I am adding points to the series at a timed interval using lv_chart_set_next_value(), and setting the chart to LV_CHART_UPDATE_MODE_SHIFT.
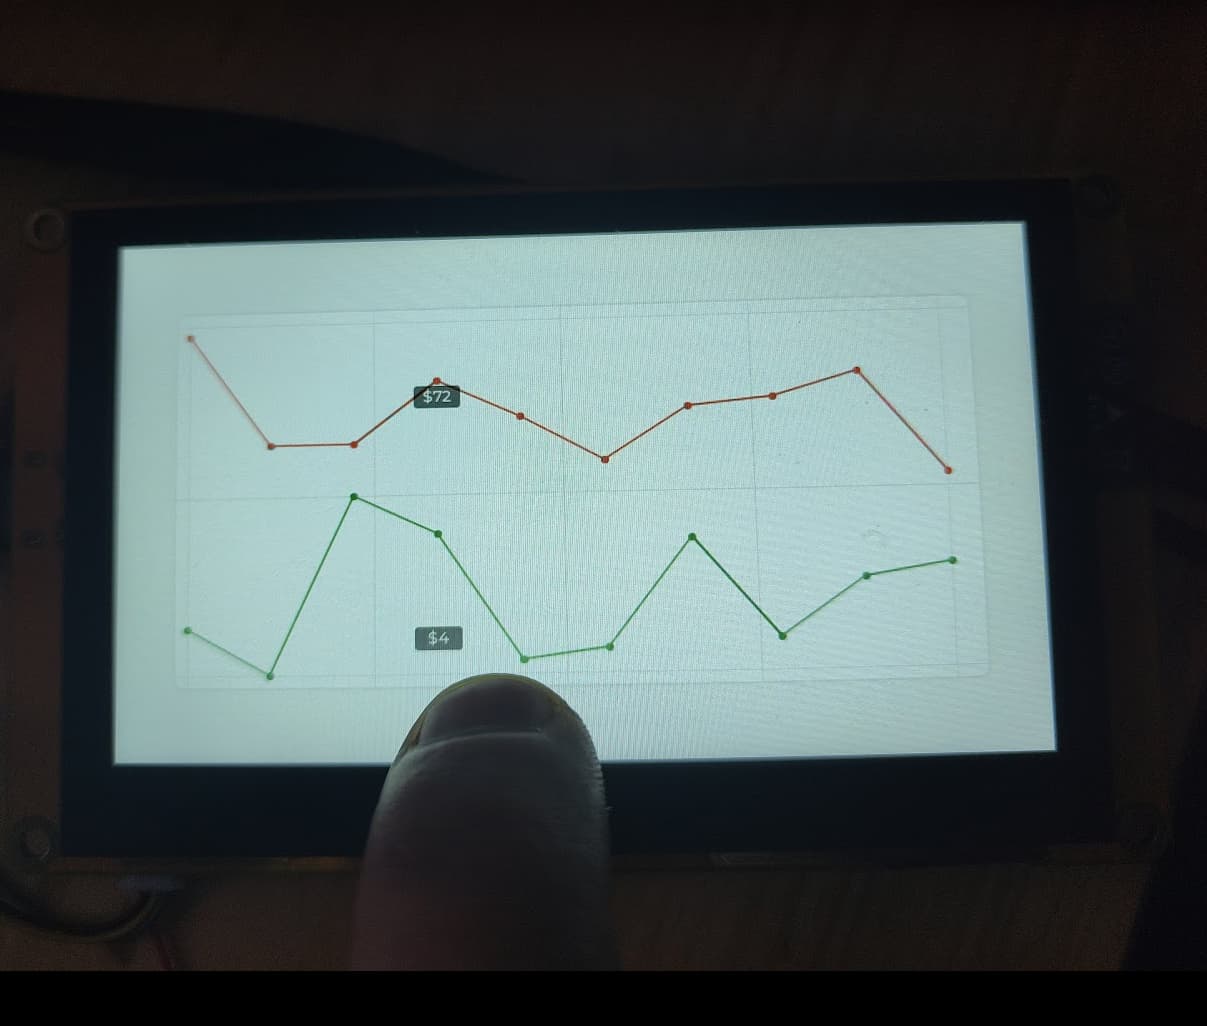
The issue is - the labels don’t match the points.
They only match for 1 time, exactly when the point count (lv_chart_set_point_count) matches how many times lv_chart_set_next_value() has been run.
As soon as lv_chart_set_next_value() is run next, either the coordinates that lv_chart_get_point_pos_by_id reports are wrong, or lv_chart_get_y_array() isn’t correct.
I suspect maybe it’s to do with the LV_CHART_UPDATE_MODE_SHIFT mechanism and the way it maintains a circular buffer, does it remap the indices of the array without moving the data to the left?
The chart is showing 10 values. Up to the first 10, the labels appear correct just oriented to the left of the display. But once the 11th value is added to the series, the labels change value and positions no longer match.
What MCU/Processor/Board and compiler are you using?
ESP32-S3, Arduino IDE, ESP32 core 2.0.12
What LVGL version are you using?
8.3.6
What do you want to achieve?
Labels that hover avobe the data points, with the correct values like in the example.
Code to reproduce
#include <lvgl.h>
#include <Arduino_GFX_Library.h>

#define   LV_COLOR_RED   LV_COLOR_MAKE(0xFF, 0x00, 0x00)
#define   LV_COLOR_GREEN   LV_COLOR_MAKE(0x00, 0x80, 0x00)

//Arduino_GFX *gfx = create_default_Arduino_GFX();

Arduino_ESP32RGBPanel *bus = new Arduino_ESP32RGBPanel(
    GFX_NOT_DEFINED /* CS */, GFX_NOT_DEFINED /* SCK */, GFX_NOT_DEFINED /* SDA */,
    40 /* DE */, 41 /* VSYNC */, 39 /* HSYNC */, 42 /* PCLK */,
    45 /* R0 */, 48 /* R1 */, 47 /* R2 */, 21 /* R3 */, 14 /* R4 */,
    5 /* G0 */, 6 /* G1 */, 7 /* G2 */, 15 /* G3 */, 16 /* G4 */, 4 /* G5 */,
    8 /* B0 */, 3 /* B1 */, 46 /* B2 */, 9 /* B3 */, 1 /* B4 */
);

Arduino_RPi_DPI_RGBPanel *gfx = new Arduino_RPi_DPI_RGBPanel(
   bus,
   800 /* width */, 0 /* hsync_polarity */, 8 /* hsync_front_porch */, 4 /* hsync_pulse_width */, 8 /* hsync_back_porch */,
   480 /* height */, 0 /* vsync_polarity */, 8 /* vsync_front_porch */, 4 /* vsync_pulse_width */, 8 /* vsync_back_porch */,
   1 /* pclk_active_neg */, 14000000 /* prefer_speed */, true /* auto_flush */);

#include "touch.h"

static uint32_t screenWidth;
static uint32_t screenHeight;
static lv_disp_draw_buf_t draw_buf;
static lv_color_t *disp_draw_buf;
static lv_disp_drv_t disp_drv;

void my_disp_flush(lv_disp_drv_t *disp, const lv_area_t *area, lv_color_t *color_p)
{
  uint32_t w = (area->x2 - area->x1 + 1);
  uint32_t h = (area->y2 - area->y1 + 1);

#if (LV_COLOR_16_SWAP != 0)
  gfx->draw16bitBeRGBBitmap(area->x1, area->y1, (uint16_t *)&color_p->full, w, h);
#else
  gfx->draw16bitRGBBitmap(area->x1, area->y1, (uint16_t *)&color_p->full, w, h);
#endif

  lv_disp_flush_ready(disp);
}

void my_touchpad_read(lv_indev_drv_t *indev_driver, lv_indev_data_t *data) {
  if (touch_has_signal()) {
    if (touch_touched()) {
      data->state = LV_INDEV_STATE_PR;

      /*Set the coordinates*/
      data->point.x = touch_last_x;
      data->point.y = touch_last_y;
    } else if (touch_released()){
      data->state = LV_INDEV_STATE_REL;
    }
  } else {
    data->state = LV_INDEV_STATE_REL;
  }
}

TimerHandle_t addPointsTimerXTimer;
lv_obj_t * chart;
lv_chart_series_t * ser1;
lv_chart_series_t * ser2;

void setup()
{
  addPointsTimerXTimer = xTimerCreate("AddPointsTimer", pdMS_TO_TICKS(10000), pdTRUE, (void*)0, reinterpret_cast<TimerCallbackFunction_t>(addPoints)); // Chart is updated 2s after the data has been requested.


  Serial.begin(115200);

  pinMode(2, OUTPUT);
  analogWrite(2, 200);

  gfx->begin();

  lv_init();
  delay(10);
  touch_init();

  screenWidth = gfx->width();
  screenHeight = gfx->height();

  disp_draw_buf = (lv_color_t *)heap_caps_malloc(sizeof(lv_color_t) * screenWidth * screenHeight/8 , MALLOC_CAP_8BIT|MALLOC_CAP_INTERNAL);

  lv_disp_draw_buf_init(&draw_buf, disp_draw_buf, NULL, screenWidth * screenHeight/8);
  lv_disp_drv_init(&disp_drv);
  disp_drv.hor_res = screenWidth;
  disp_drv.ver_res = screenHeight;
  disp_drv.flush_cb = my_disp_flush;
  disp_drv.draw_buf = &draw_buf;

  lv_disp_drv_register(&disp_drv);

  disp_drv.hor_res = 800;
  disp_drv.ver_res = 480;

  static lv_indev_drv_t indev_drv;
  lv_indev_drv_init(&indev_drv);
  indev_drv.type = LV_INDEV_TYPE_POINTER;
  indev_drv.read_cb = my_touchpad_read;
  lv_indev_drv_register(&indev_drv);

  Serial.println("Setup done");
  //ui_init();

  xTimerStart(addPointsTimerXTimer,0);

  lv_example_chart_4();
}

void loop(){
  lv_task_handler();
}

void addPoints() {
  lv_chart_set_next_value(chart, ser1, lv_rand(50, 100));
  lv_chart_set_next_value(chart, ser2, lv_rand(0, 50));
  //lv_chart_refresh(chart); not needed
}


static void event_cb(lv_event_t * e)
{
    lv_event_code_t code = lv_event_get_code(e);
    lv_obj_t * chart = lv_event_get_target(e);

    if(code == LV_EVENT_VALUE_CHANGED) {
        lv_obj_invalidate(chart);
    }
    if(code == LV_EVENT_REFR_EXT_DRAW_SIZE) {
        //lv_coord_t * s = lv_event_get_param(e);
        lv_coord_t * s = (lv_coord_t *)lv_event_get_param(e);

        *s = LV_MAX(*s, 20);
    }
    else if(code == LV_EVENT_DRAW_POST_END) {
        int32_t id = lv_chart_get_pressed_point(chart);
        if(id == LV_CHART_POINT_NONE) return;

        LV_LOG_USER("Selected point %d", (int)id);

        lv_chart_series_t * ser = lv_chart_get_series_next(chart, NULL);
        while(ser) {
            lv_point_t p;
            lv_chart_get_point_pos_by_id(chart, ser, id, &p);

            lv_coord_t * y_array = lv_chart_get_y_array(chart, ser);
            lv_coord_t value = y_array[id];

            char buf[16];
            lv_snprintf(buf, sizeof(buf), LV_SYMBOL_DUMMY"$%d", value);

            lv_draw_rect_dsc_t draw_rect_dsc;
            lv_draw_rect_dsc_init(&draw_rect_dsc);
            draw_rect_dsc.bg_color = lv_color_black();
            draw_rect_dsc.bg_opa = LV_OPA_50;
            draw_rect_dsc.radius = 3;
            draw_rect_dsc.bg_img_src = buf;
            draw_rect_dsc.bg_img_recolor = lv_color_white();

            lv_area_t a;
            a.x1 = chart->coords.x1 + p.x - 20;
            a.x2 = chart->coords.x1 + p.x + 20;
            a.y1 = chart->coords.y1 + p.y - 30;
            a.y2 = chart->coords.y1 + p.y - 10;

            lv_draw_ctx_t * draw_ctx = lv_event_get_draw_ctx(e);
            lv_draw_rect(draw_ctx, &draw_rect_dsc, &a);

            ser = lv_chart_get_series_next(chart, ser);
        }
    }
    else if(code == LV_EVENT_RELEASED) {
        lv_obj_invalidate(chart);
    }
}

void lv_example_chart_4(void)
{
    chart = lv_chart_create(lv_scr_act());
    lv_obj_set_size(chart, 700, 350);
    lv_obj_center(chart);

    lv_chart_set_update_mode(chart, LV_CHART_UPDATE_MODE_SHIFT);
    lv_chart_set_point_count(chart, 10);

    /*Zoom in a little in X*/
    lv_chart_set_zoom_x(chart, 250);

    lv_obj_add_event_cb(chart, event_cb, LV_EVENT_ALL, NULL);
    lv_obj_refresh_ext_draw_size(chart);

    /*Add two data series*/
    ser1 = lv_chart_add_series(chart, lv_palette_main(LV_PALETTE_RED), LV_CHART_AXIS_PRIMARY_Y);
    ser2 = lv_chart_add_series(chart, lv_palette_main(LV_PALETTE_GREEN), LV_CHART_AXIS_PRIMARY_Y);
//    uint32_t i;
//    for(i = 0; i < 100; i++) {
//        lv_chart_set_next_value(chart, ser1, lv_rand(50, 100));
//        lv_chart_set_next_value(chart, ser2, lv_rand(0, 50));
//    }
}
Screenshot and/or video
It would be a long video, but I will record and host somewhere else if you need more clarity