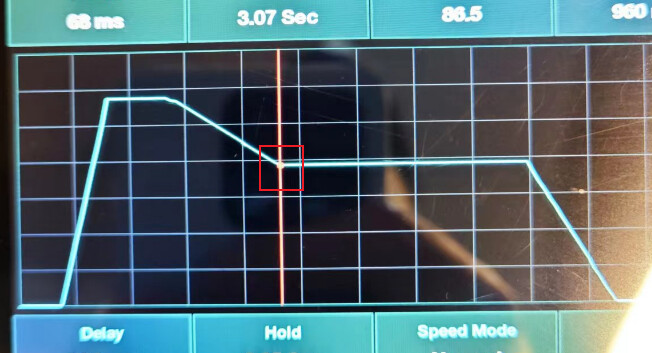
How can I set the properties of the intersection point of the cursor in a chart, such as color and size?