Random dots on screen

Description

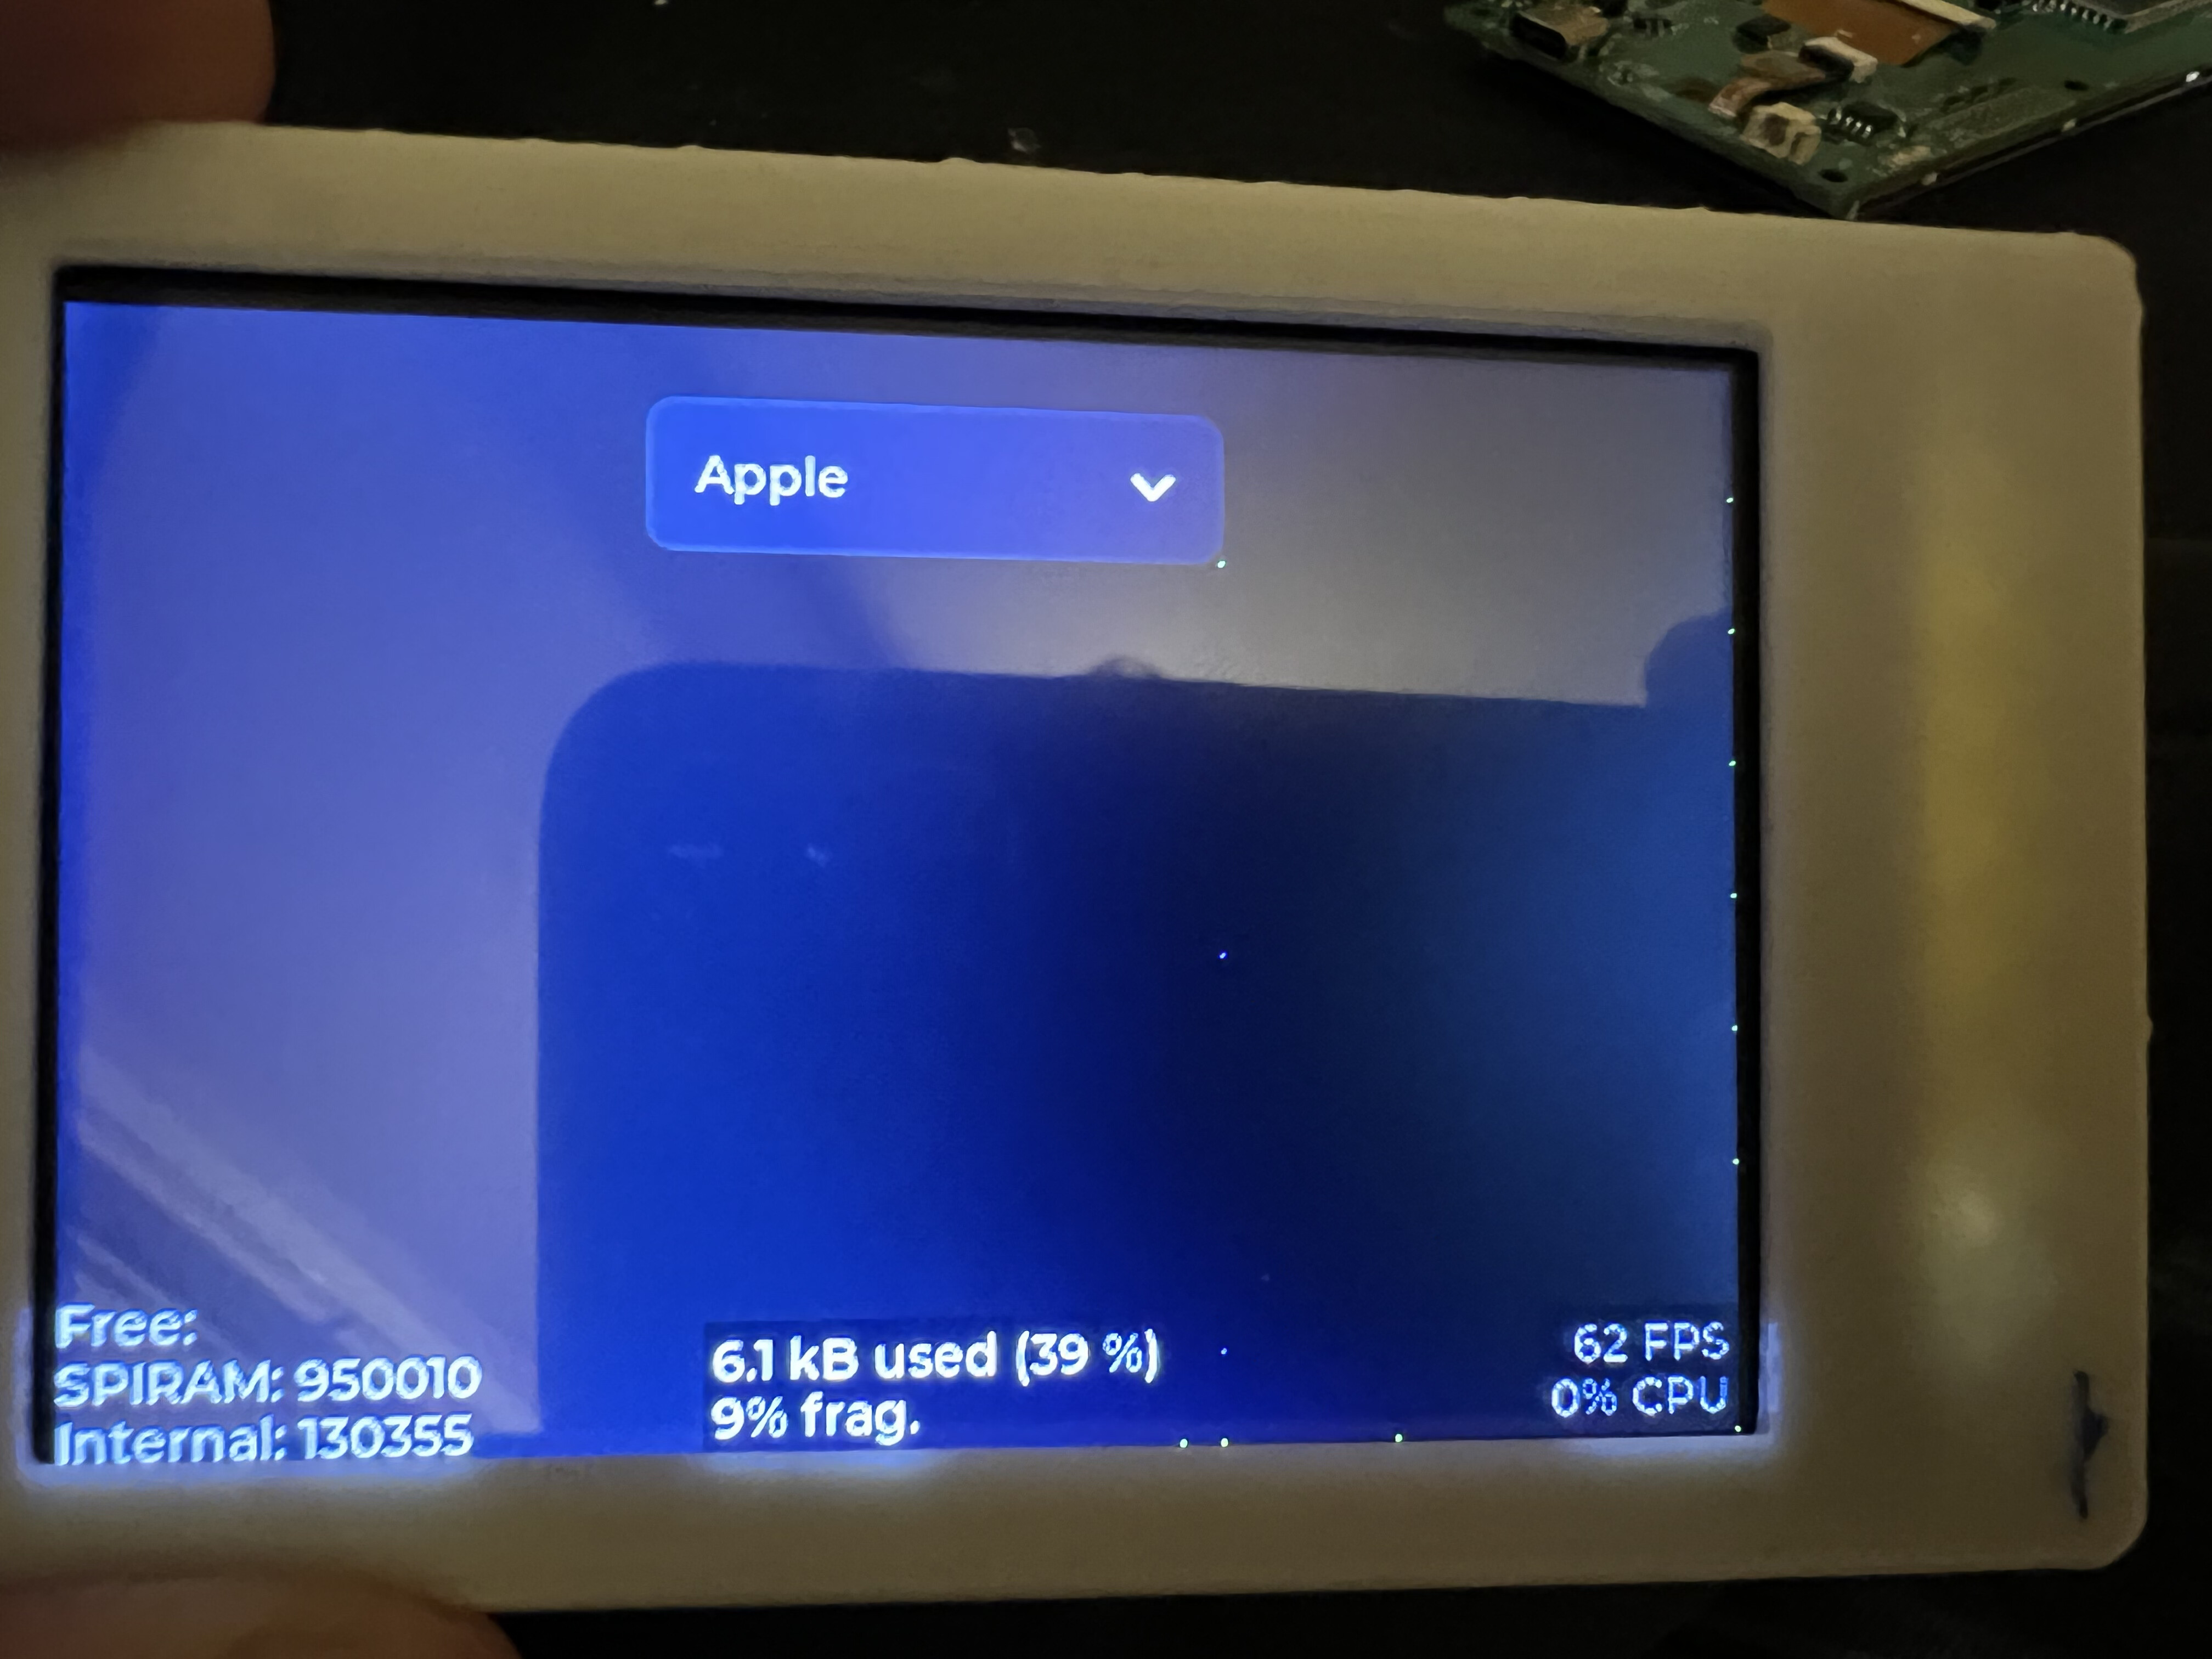
When I run my LVGL app I see random dots on the screen (green and blue as you can see). They are 100% same every time. It appeared after I updated my LVGL version. Sadly I do not have a record of my previous LVGL version so I am a bit sad on how to fix it. It kinda looks like debug dots, as they are very regular. I tested it on multiple devices. Any idea what I can to debug?

What MCU/Processor/Board and compiler are you using?

ESP32-S2, ILI9488, FT6206, custom PCB.

What have you tried so far?

Updating to master. Different widgets?

Code to reproduce

N/A

Anyone have any thoughts? I tried to google and search on forums, but nothing came up for “random dots” :frowning:

Are they random or always in the same place? if they are consistent, it is probably from the disp_flush function not sending the whole frame especially the last pixel. Otherwise if they are random, check the wires that goes to the LCD.

Always in the same place.

There’s two sets of dots: one on the far right edge of the screen, spaced at certain distance, and one set a pixel to the right of where the menu bar opens.

I will look at the disp_flush, thank you! It’s just so weird and strange.

I guess I can delete all the things on the screen, then put an if statement to see if it sends green color at all?

I encauntered the same problem a while ago. It was the disp_flush function sends all the frame pixels except the last one, hence the white dots at the end of each frame.

I suggest you manually call the disp_flush function and send some frames to the LCD before the Lvgl library is initialized. If the dots appear, then it is definitely from this function.

Interesting.

Can you give me pointers please? Here is the code I tried, but it does not seem to display anything. Am I missing any flushing code?

    lv_area_t left_top, right_top, middle;
    lv_color_t red, green, blue;
    left_top.x1=left_top.y1=0; left_top.x2=left_top.y2=50;
    middle.x1=100; middle.y1=100; middle.x2=150; middle.y2=150;
    right_top.x1=200; right_top.y1=0; right_top.x2=250; right_top.y2=50;
    red.ch.red=31; 
    green.ch.green=63;
    blue.ch.blue=31;
    

    ili9488_flush(NULL,&left_top,&red);
    ili9488_flush(NULL,&right_top,&green);
    ili9488_flush(NULL,&middle,&blue);

    while(1);

The disp_flush function takes an array of lv_color_t. Try something like this.

	lv_color_t buf_1[50*50];         // I think it should be global variable               
	for (int i = 0; i<50*50; i++){
		buf_1[i] = red;
	}
	disp_flush(NULL,&left_top,buf_1);

	for (int i = 0; i<50*50; i++){
		buf_1[i] = green;
	}
	disp_flush(NULL,&right_top,buf_1);

	for (int i = 0; i<50*50; i++){
		buf_1[i] = blue;
	}
	disp_flush(NULL,&middle,buf_1);
1 Like

It seems sadly I can’t easily use LVGL_ESP32 driver without initializing LVGL as well. I tried several things, but it seems that LVGL_ESP32 init actually goes and initializes a timer that checks if SPI is free for a transaction. This causes it to crash in spi_ready code.

Also not sure why it’s drawing in the same place. Should I try to use the built in screenshot function to see what it " thinks" is on the display?


#define temp_size 100
lv_color_t buf_1[temp_size*temp_size];

void guiTask(void *pvParameter)
{

    lvgl_driver_init();

    lv_area_t left_top, right_top, middle;
    lv_color_t red={0}, green={0}, blue={0};
    left_top.x1=left_top.y1=0; left_top.x2=left_top.y2=temp_size;
    middle.x1=100; middle.y1=100; middle.x2=100+temp_size; middle.y2=100+temp_size;
    right_top.x1=200; right_top.y1=0; right_top.x2=200+temp_size; right_top.y2=temp_size;
    red.ch.red=31; 
    green.ch.green=63;
    blue.ch.blue=31;
    
    for (int i = 0; i<temp_size*temp_size; i++){
		buf_1[i] = red;
	}
	disp_driver_flush(NULL,&left_top,buf_1);


    for (int i = 0; i<temp_size*temp_size; i++){
		buf_1[i] = green;
	}
	disp_driver_flush(NULL,&right_top,buf_1);


	for (int i = 0; i<temp_size*temp_size; i++){
		buf_1[i] = blue;
	}
	disp_driver_flush(NULL,&middle,buf_1);

    while(1)   vTaskDelay(1000 / portTICK_PERIOD_MS);;
}
Guru Meditation Error: Core  0 panic'ed (LoadProhibited). Exception was unhandled.

Core  0 register dump:
PC      : 0x4002bd01  PS      : 0x00060031  A0      : 0x8002c73c  A1      : 0x3ffcc9b0
0x4002bd01: spi_ready at F:\Programming\ESP32-Sensor-Software\build/../components/lvgl_esp32_drivers/lvgl_tft/disp_spi.c:316

A2      : 0x3ffde224  A3      : 0x3ffcf3cc  A4      : 0x22341313  A5      : 0x00000000
A6      : 0x3ffccc00  A7      : 0x00000050  A8      : 0x8002bd01  A9      : 0x3ffcc980
A10     : 0x00000000  A11     : 0x22341313  A12     : 0x22341313  A13     : 0x3ffd8be0
A14     : 0x00060523  A15     : 0x00000000  SAR     : 0x0000001d  EXCCAUSE: 0x0000001c
EXCVADDR: 0x00000000  LBEG    : 0x22341313  LEND    : 0x3ffd8be0  LCOUNT  : 0x4002b465
0x4002b465: _xt_user_exc at F:/Programming/esp-idf/components/freertos/port/xtensa/xtensa_vectors.S:633

Core  0 was running in ISR context:
EPC1    : 0x40083ea5  EPC2    : 0x00000000  EPC3    : 0x00000000  EPC4    : 0x00000000
0x40083ea5: panic_print_str at F:/Programming/esp-idf/components/esp_system/panic.c:126


Backtrace:0x4002bcfe:0x3ffcc9b00x4002c739:0x3ffcc9e0 0x4002c8e9:0x3ffcca10 0x4002b586:0x3ffcca40 0x40096bc3:0x3ffd8c80 0x40114cc7:0x3ffd8cb0
0x4002bcfe: spi_ready at F:\Programming\ESP32-Sensor-Software\build/../components/lvgl_esp32_drivers/lvgl_tft/disp_spi.c:308

0x4002c739: spi_post_trans at F:/Programming/esp-idf/components/driver/spi_master.c:579 (discriminator 1)

0x4002c8e9: spi_intr at F:/Programming/esp-idf/components/driver/spi_master.c:613

0x4002b586: _xt_lowint1 at F:/Programming/esp-idf/components/freertos/port/xtensa/xtensa_vectors.S:1111

0x40096bc3: esp_vApplicationIdleHook at F:/Programming/esp-idf/components/esp_system/freertos_hooks.c:50

0x40114cc7: prvIdleTask at F:/Programming/esp-idf/components/freertos/tasks.c:3974


ELF file SHA256: f66a23e3d885963d

CPU halted.

Mmm interesting. I am sorry I am not that familiar with RTOS. :sweat_smile:

It is very strange. Try to breakpoint on each flush call and see what has been drown each time breakpoint hits or enter a delay between flushes. I suspect if you are using DMA with SPI, you are changing the content of the buffer before the current dma transfer complete.

Also, could you post your disp_driver_flush function or just use the one in the github and try it out, it may work with you?

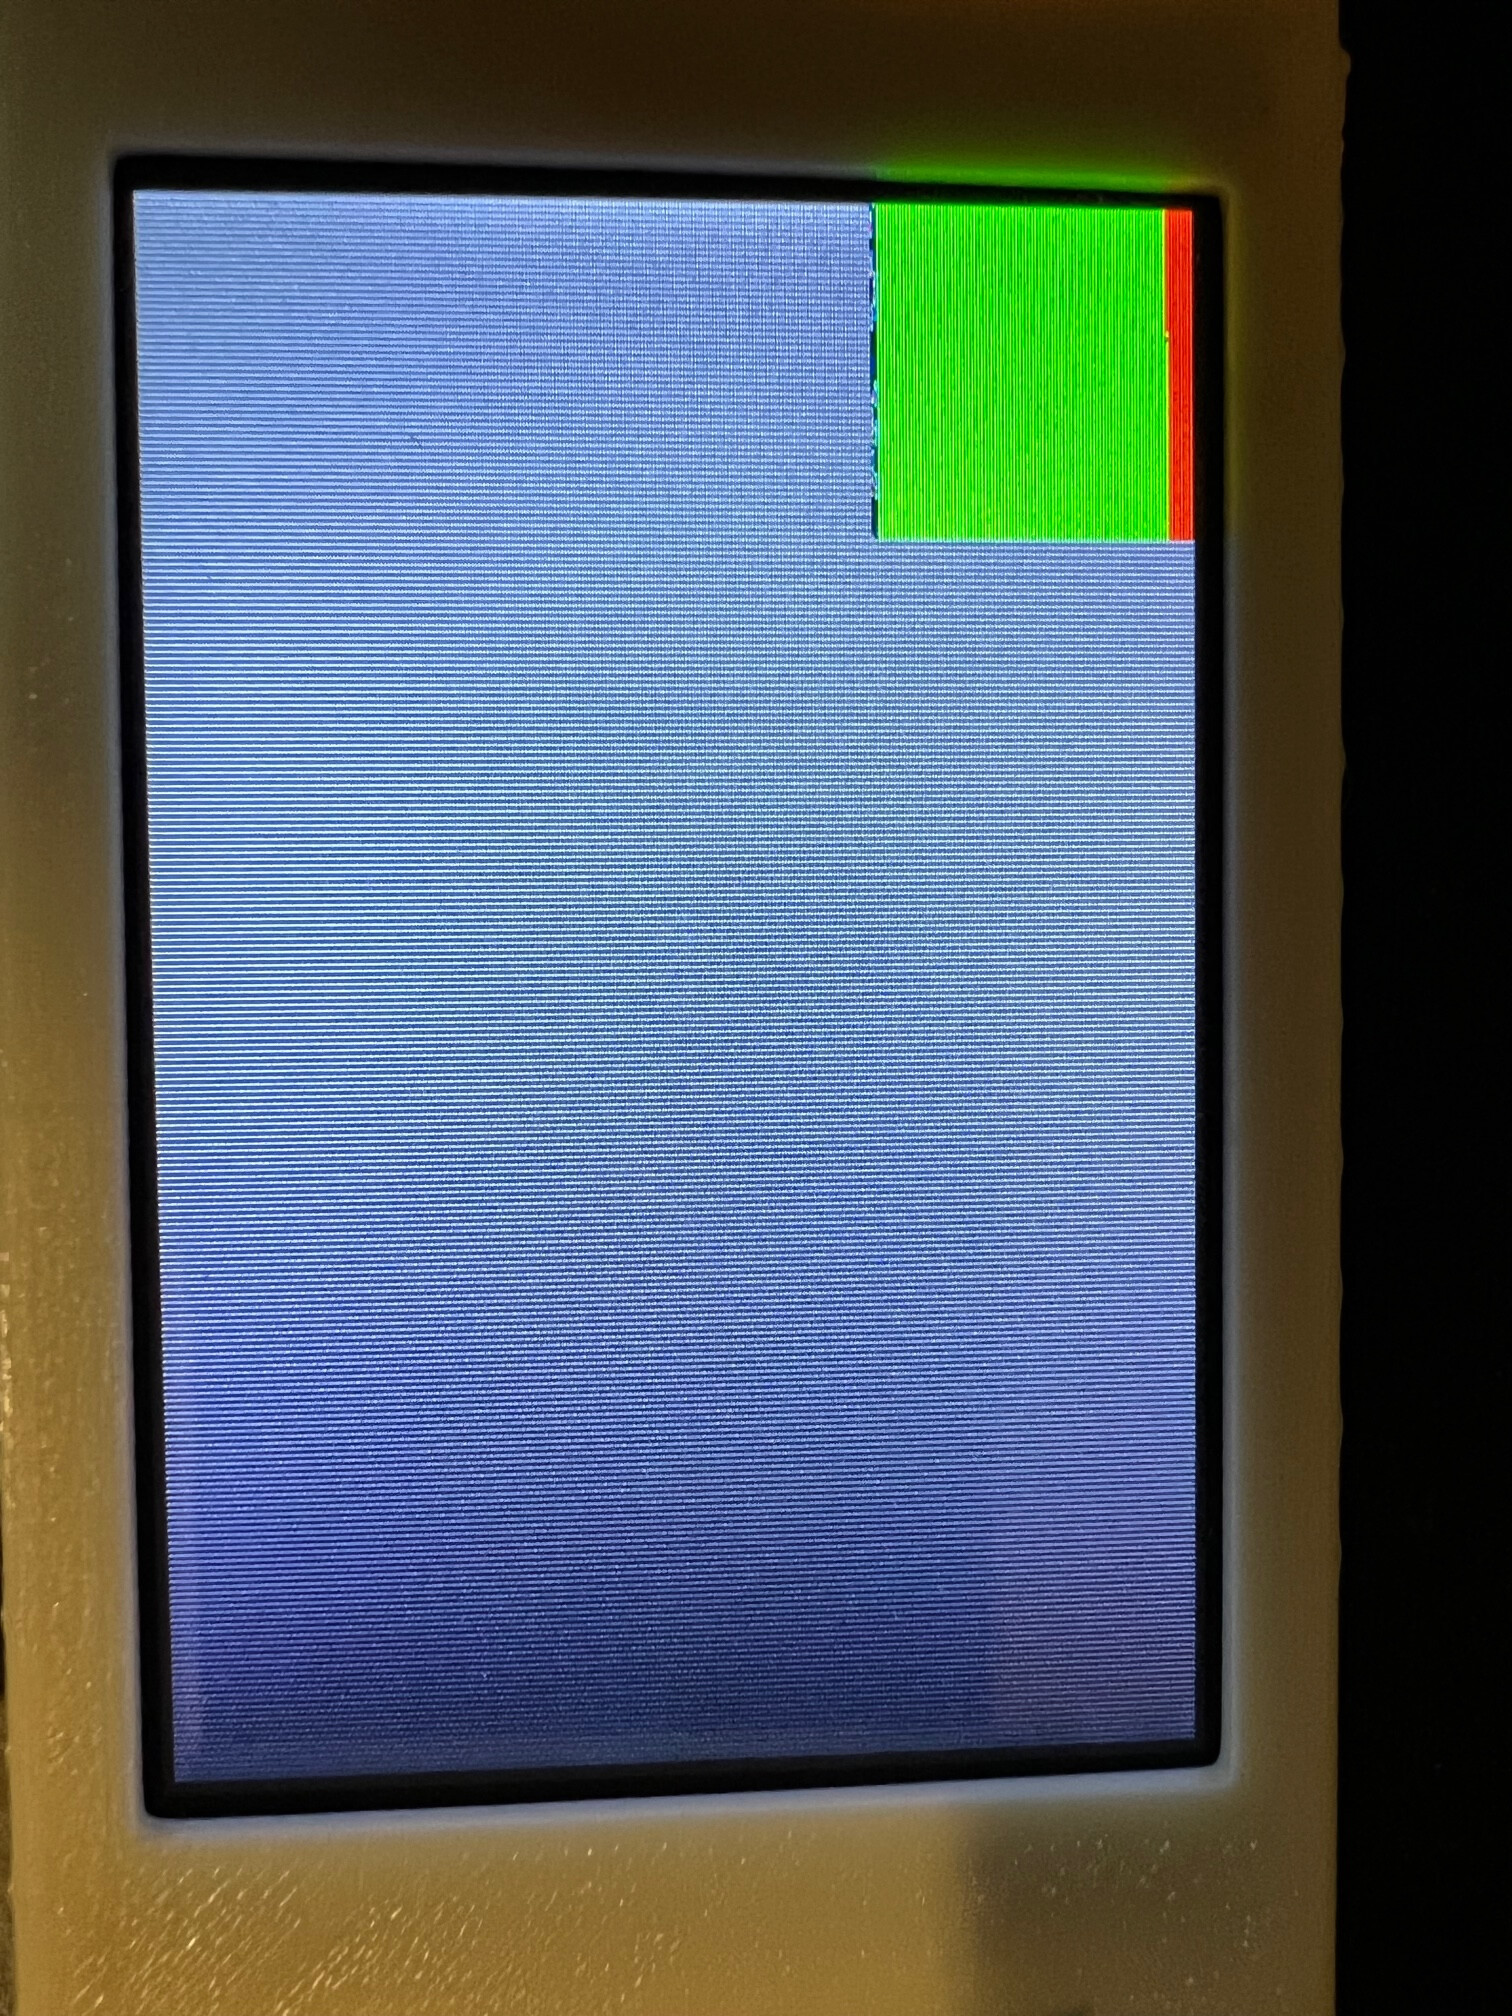
I had this same exact issue when I switched from 160MHz core clock / 100Hz FreeRTOS tickrate to 240MHz core clock / 1000Hz tickrate. I’m using an ESP32-S3 with ILI9488 and an 8-bit parallel interface. On the scope at the very start of transaction, the pins would be high too long and spill over into the next byte. This had the effect of creating mostly green dots in the top left of drawn regions, occasionally the position would be affected and rarer yet the whole frame would get corrupted.

I reduced my esp_lcd_panel_io_i80_config_t pckl_hz from 10MHz down to 5MHz and it appears to be working now. Also edited, I spoke too soon and made an incorrect statement about the periodic lvgl timer :slight_smile:

Not sure if this is your exact issue or if you’ve solved by now but I found this post by Google, maybe it will help someone else.