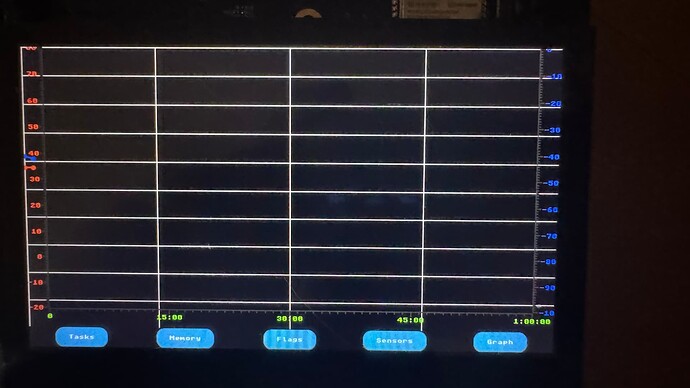
Description
What MCU/Processor/Board and compiler are you using?
ESP32-S#-LCD-EV-BOARD2 (800x480)
What LVGL version are you using?
v9.2
What I have achieved so far?
screen configured, objects created including containers, chart, scales, buttons
Positioning & drawing the left & right vertical scales, in correct position and updating
Positioning & drawing the bottom horizontal scale, in correct position and updating when required
Buttons correctly positioned and working, selecting between the 5 different screens
What do you want to achieve?
Reduce the area of the chart, as demarcated by the horizontal and vertical divider lines, to fit inside VL, VR & HB scales
Ensure the extreme hor/ver divider lines line up with the lowest and highest values on the scales
What have you tried so far?
Everything I could think of or imagine, too many to mention.
Have not yet put it through the simulator since nothing indicates a hardware problem
Code to reproduce
The code is part of a much larger project so have not been able separate out an independent snippet to compile.
Since the problem must be very simple, for anyone other than a complete LVGL beginner like myself, I trust the snippets below will be sufficient to identify the cause.
#define lvglBORDER_WID			0
#define lvglBUTTON_NUM			5
#define lvglBUTTON_PY			32					// pixel height allowed for buttons

// text window
#define lvglWINDOW_PX			(halLCD_MAX_PX - (2*lvglBORDER_WID))
#define lvglWINDOW_PY			(halLCD_MAX_PY - (2*lvglBORDER_WID) - lvglBUTTON_PY)
#define lvglWINDOW_TLX			lvglBORDER_WID
#define lvglWINDOW_TLY			lvglBORDER_WID

// scales
#define lvglSCALE_PX			32					// VERtical scale WIDTH
#define lvglSCALE_PY			32					// HORizontal scale HEIGHT
// scale LEFT VERTICAL
#define lvglSCALE0_PX			lvglSCALE_PX
#define lvglSCALE0_PY			(lvglWINDOW_TLY + lvglWINDOW_PY - lvglSCALE_PY)
#define lvglSCALE0_TLX			lvglWINDOW_TLX
#define lvglSCALE0_TLY			lvglWINDOW_TLY
// scale RIGHT VERTICAL
#define lvglSCALE1_PX			lvglSCALE_PX
#define lvglSCALE1_PY			(lvglWINDOW_TLY + lvglWINDOW_PY - lvglSCALE_PY)
#define lvglSCALE1_TLX			(lvglWINDOW_TLX + lvglWINDOW_PX - lvglSCALE1_PX)
#define lvglSCALE1_TLY			lvglWINDOW_TLY
// scale BOTTOM HORIZONTAL
#define lvglSCALE2_PX			(lvglWINDOW_TLX + lvglWINDOW_PX - lvglSCALE0_PX - lvglSCALE1_PX)
#define lvglSCALE2_PY			lvglSCALE_PY
#define lvglSCALE2_TLX			(lvglSCALE0_TLX + lvglSCALE0_PX)
#define lvglSCALE2_TLY			(lvglSCALE0_TLY + lvglSCALE0_PY)

// chart object
#define lvlglCHART_MARGIN_X		0
#define lvlglCHART_MARGIN_Y		0
#define	lvglCHART_PX			(lvglWINDOW_PX - lvlglCHART_MARGIN_X)
#define	lvglCHART_PY			(lvglWINDOW_PY - lvlglCHART_MARGIN_Y)

// button object(s)
#define lvglBUTTON_TLX			lvglBORDER_WID
#define lvglBUTTON_TLY			(lvglWINDOW_TLY + lvglWINDOW_PY)
#define lvglBUTTON_PX			(halLCD_MAX_PX - (2*lvglBORDER_WID))
#define lvglBUTTON_PX_EA		(lvglBUTTON_PX / lvglBUTTON_NUM)

const lv_style_const_prop_t ConstDefault[] = {
	LV_STYLE_CONST_WIDTH(halLCD_MAX_PX),
	LV_STYLE_CONST_HEIGHT(halLCD_MAX_PY),
	LV_STYLE_CONST_BORDER_WIDTH(0),
	LV_STYLE_CONST_BORDER_SIDE(0),
	LV_STYLE_CONST_PAD_BOTTOM(0),
	LV_STYLE_CONST_PAD_LEFT(0),
	LV_STYLE_CONST_PAD_RIGHT(0),
	LV_STYLE_CONST_PAD_TOP(0),
	LV_STYLE_CONST_BG_OPA(LV_OPA_100),
	LV_STYLE_CONST_TEXT_OPA(LV_OPA_100),
	LV_STYLE_CONST_BG_COLOR(lvglCOLOR_BLACK),
	LV_STYLE_CONST_TEXT_COLOR(lvglCOLOR_WHITE),
	LV_STYLE_CONST_TEXT_FONT((const void *)&lv_font_unscii_8),
	LV_STYLE_CONST_PROPS_END
};
LV_STYLE_CONST_INIT(sStyleDefault, ConstDefault);

const lv_style_const_prop_t ConstInfoWin[] = {
	LV_STYLE_CONST_WIDTH(lvglWINDOW_PX),
	LV_STYLE_CONST_HEIGHT(lvglWINDOW_PY),
//	LV_STYLE_CONST_FLEX_FLOW(LV_FLEX_FLOW_COLUMN),
	LV_STYLE_CONST_PROPS_END
};
LV_STYLE_CONST_INIT(sStyleInfoWin, ConstInfoWin);

const lv_style_const_prop_t ConstChart[] = {
	LV_STYLE_CONST_WIDTH(lvglCHART_PX),
	LV_STYLE_CONST_HEIGHT(lvglCHART_PY),
//	LV_STYLE_CONST_FLEX_GROW(1),
//	LV_STYLE_CONST_ALIGN(LV_ALIGN_TOP_MID),
	LV_STYLE_CONST_RADIUS(0),
	LV_STYLE_CONST_PROPS_END
};
LV_STYLE_CONST_INIT(sStyleChart, ConstChart);

scale_var_t * psGuiCreateScale(lv_obj_t * poChart, const scale_cfg_t * psScC, int axis) {
	scale_var_t * psScV = (scale_var_t *) calloc(1, sizeof(scale_var_t));
	psScV->poScale = lv_scale_create(poChart);
	IF_myASSERT(debugRESULT, psScV->poScale);
	lv_scale_set_mode(psScV->poScale, axis2LvMode[axis]);
   	lv_scale_set_total_tick_count(psScV->poScale, psScC->TotalTick);
   	lv_scale_set_major_tick_every(psScV->poScale, psScC->MajorEvery);
	// set position & size
	lv_obj_set_pos(psScV->poScale, psScC->sCoord.tlX, psScC->sCoord.tlY);
	lv_obj_set_size(psScV->poScale, psScC->sCoord.widX, psScC->sCoord.widY);
	// set lengths & colors for major and minor ticks
	lv_obj_set_style_length(psScV->poScale, psScC->MElength, LV_PART_INDICATOR);
	lv_obj_set_style_text_color(psScV->poScale, psScC->Color, LV_PART_INDICATOR);
	lv_obj_set_style_length(psScV->poScale, psScC->TTlength, LV_PART_ITEMS);
	if (axis <= axisVR) {			// Left & Right vertical scales
	 	psScV->poSeries = lv_chart_add_series(poChart, psScC->Color, axis2LvAxis[axis]);
		lv_chart_set_range(poChart, axis2LvAxis[axis], psScC->LoVal.i32, psScC->HiVal.i32);
	} else {						// Bottom & Top horizontal scales
//		lv_obj_set_style_pad_hor(psScV->poScale, lv_chart_get_first_point_center_offset(poChart), LV_PART_MAIN);
	}
	if (psScC->pcFmt) {				// custom format requested, allocate buffers and initialise
		psScV->count = (psScC->TotalTick / psScC->MajorEvery) + 1;			// number of labels
		psScV->sBuf = psScV->count * psScC->SizeFmt;						// size of label buffer
		IF_myASSERT(debugTRACK, psScV->sBuf < 16384);
		psScV->pcBuf = (char *) calloc(psScV->count, psScC->SizeFmt);		// allocate label buffer
		psScV->paLabels = (const char **) calloc(psScV->count+1, sizeof(const char *));	// 1 extra
		vGuiUpdateScale(psScC, psScV, (x32_t) 0, (x32_t) (psScC->MajorEvery * psScC->Points));
	} else {
		lv_scale_set_range(psScV->poScale, psScC->LoVal.i32, psScC->HiVal.i32);
		lv_scale_set_label_show(psScV->poScale, true);
	}
	psScV->tReload = psScC->Intvl;						// start the timer at 0 for immediate 1st update
	return psScV;
}

void vGuiInit(void) {
	sGuiVar.poDisplay = bsp_display_start();
	IF_myASSERT(debugRESULT, sGuiVar.poDisplay != 0);
	lv_tick_set_cb(xGuiGetMillis);
	lv_log_register_print_cb(vGuiSyslog);
	lvgl_port_lock(0);
	{	// Get & configure top level screen
		sGuiVar.poScreen = lv_display_get_screen_active(sGuiVar.poDisplay);
//		sGuiVar.poScreen = lv_obj_create(lv_screen_active());
		IF_myASSERT(debugRESULT, sGuiVar.poScreen);
		lv_obj_remove_style_all(sGuiVar.poScreen);
		lv_obj_add_style(sGuiVar.poScreen, &sStyleDefault, LV_PART_MAIN);
	}
	{	// Create Text object
		sGuiVar.poText = lv_label_create(sGuiVar.poScreen);
//		sGuiVar.poText = lv_textarea_create(sGuiVar.poScreen);
		lv_obj_add_style(sGuiVar.poText, &sStyleDefault, LV_PART_MAIN);
		lv_obj_add_style(sGuiVar.poText, &sStyleInfoWin, LV_PART_MAIN);		//  InfoWindow (Text & Graph) specifics
	}
	{	// Create Graph "wrapper" for chart, scales & series
		sGuiVar.poGraph = lv_obj_create(sGuiVar.poScreen);
		lv_obj_add_style(sGuiVar.poGraph, &sStyleDefault, LV_PART_MAIN);
		lv_obj_add_style(sGuiVar.poGraph, &sStyleInfoWin, LV_PART_MAIN);	//  InfoWindow (Text & Graph) specifics
	}
	{	// Create Chart object
		sGuiVar.poChart = lv_chart_create(sGuiVar.poGraph);
		lv_obj_add_style(sGuiVar.poChart, &sStyleDefault, LV_PART_MAIN);
		lv_obj_add_style(sGuiVar.poChart, &sStyleChart, LV_PART_MAIN);		// 	Chart specific
		lv_obj_align(sGuiVar.poChart, LV_ALIGN_TOP_LEFT, lvlglCHART_MARGIN_X/2, lvlglCHART_MARGIN_Y/2);
		lv_chart_set_type(sGuiVar.poChart, LV_CHART_TYPE_LINE);
		lv_chart_set_point_count(sGuiVar.poChart, sGraphCfg.Points);
		lv_chart_set_update_mode(sGuiVar.poChart, LV_CHART_UPDATE_MODE_SHIFT);
		lv_chart_set_div_line_count(sGuiVar.poChart, sGraphCfg.DivLineX, sGraphCfg.DivLineY);
	}
	{	// create scale object(s)
		for (int axis = axisVL; axis < axisNUM; ++axis) {
			if (sGraphCfg.psScC[axis]) {
				sGuiVar.psScV[axis] = psGuiCreateScale(sGuiVar.poChart, sGraphCfg.psScC[axis], axis);
//				lv_obj_align_to(sGuiVar.psScV[axis]->poScale,sGuiVar.poGraph,LV_ALIGN_DEFAULT, 0, 0);

			}
		}
	}
	{	// Create button object(s)
		sGuiVar.poButtons = lv_obj_create(sGuiVar.poScreen);
		lv_obj_add_style(sGuiVar.poButtons, &sStyleDefault, LV_PART_MAIN);
		lv_obj_add_style(sGuiVar.poButtons, &sStyleBtnsWin, LV_PART_MAIN);
		lv_obj_set_pos(sGuiVar.poButtons, lvglBUTTON_TLX, lvglBUTTON_TLY);
		vGuiButtonsCreate(sGuiVar.poButtons, (btn_cfg_t *) &sBtnCfg, vGuiButtonsCB);
		lv_obj_add_event_cb(sGuiVar.poScreen, vGuiButtonsCB, LV_EVENT_PRESSED, NULL);
	}
	{
		vGuiObjectSwap(sGuiVar.poGraph, sGuiVar.poText);	// make text window (page 0->3) active
		sGuiVar.msTouchTO = lvglMS_TOUCH_TO;
		sGuiVar.psTmr = lv_timer_create(vGuiTimerCB, lvglMS_TIMER, NULL);
		lvgl_port_unlock();
	}
}
Screenshot and/or video
Just to clarify
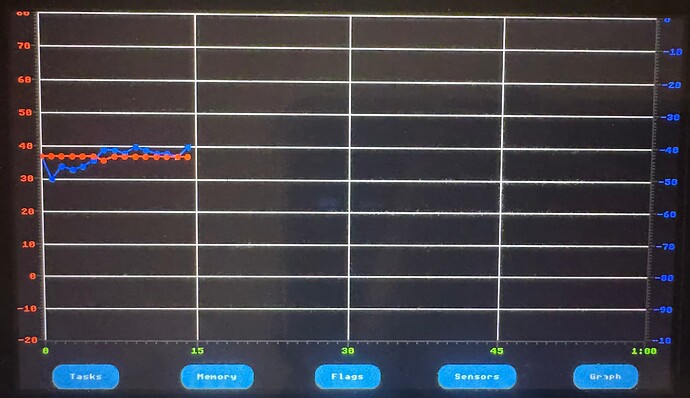
In the image above the VL/red, VR/blue and HB/green scales are at exactly the correct position.
What I am trying to do is shrink the area of the chart, as indicated by the white divider lines, to neatly occupy the area between the 3 scales.
This will then also move the starting position of the initial points slightly to the right to be immediately to the right of the VL/red scale, and the last plotting point should be immediately to the left of the VR/blue scale.

