Description
On the chart, I am attempting to put labels for the X and Y axis without success. I read that we are supposed to use lv_chart_set_margin. I tried 3 different versions of LVGL and they don’t have that function.
What MCU/Processor/Board and compiler are you using?
3 different environments:
- codeblocks simulator
- micropython environment from lv_chart web page
- Atmel ARM32, arm-none-eabi-gcc.exe
What LVGL version are you using?
- codeblocks simulator has 7.4-dev
- I don’t know where to find the LVGL version on the live micropython
- On atmel project, I am using v7.7.2
What do you want to achieve?
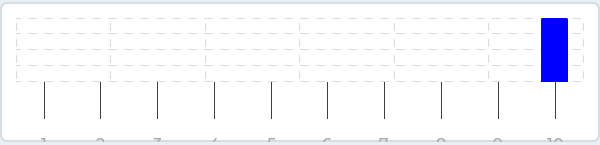
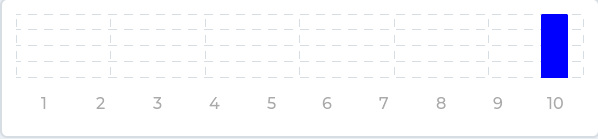
I like to add labels for the chart vertical and horizontal divisions. Only little ticks appear without text.
What have you tried so far?
lv_chart_set_margin does not compile. I tried searching the whole library with a text editor and it does not appear anywhere.
Code to reproduce
In codeblocks simulator with 7.4-dev:
in lv_conf.h :
#define LV_USE_CHART 1
 void lv_ex_chart_web(void)
{
    /*Create a chart*/
    lv_obj_t * chart;
    chart = lv_chart_create(lv_scr_act(), NULL);
    lv_obj_set_size(chart, 200, 150);
    lv_obj_align(chart, NULL, LV_ALIGN_CENTER, 0, 0);
    lv_chart_set_type(chart, LV_CHART_TYPE_LINE);   /*Show lines and points too*/

    /*Add two data series*/
    lv_chart_series_t * ser1 = lv_chart_add_series(chart, LV_COLOR_RED);
    lv_chart_series_t * ser2 = lv_chart_add_series(chart, LV_COLOR_GREEN);

    /*Set the next points on 'ser1'*/
    lv_chart_set_next(chart, ser1, 10);
    lv_chart_set_next(chart, ser1, 10);
    lv_chart_set_next(chart, ser1, 10);
    lv_chart_set_next(chart, ser1, 10);
    lv_chart_set_next(chart, ser1, 10);
    lv_chart_set_next(chart, ser1, 10);
    lv_chart_set_next(chart, ser1, 10);
    lv_chart_set_next(chart, ser1, 30);
    lv_chart_set_next(chart, ser1, 70);
    lv_chart_set_next(chart, ser1, 90);

    /*Directly set points on 'ser2'*/
    ser2->points[0] = 90;
    ser2->points[1] = 70;
    ser2->points[2] = 65;
    ser2->points[3] = 65;
    ser2->points[4] = 65;
    ser2->points[5] = 65;
    ser2->points[6] = 65;
    ser2->points[7] = 65;
    ser2->points[8] = 65;
    ser2->points[9] = 65;

   /* lv_chart_set_margin(chart, 40);*/
    lv_chart_set_x_tick_texts(chart, "1\n2\n3\n4\n5\n6\n7\n8\n9\n", 0, LV_CHART_AXIS_DRAW_LAST_TICK);

    lv_chart_set_x_tick_length(chart, 5, 8);
    lv_chart_set_y_tick_texts(chart, "123\n456\n789\n5a\n", 2, LV_CHART_AXIS_DRAW_LAST_TICK | LV_CHART_AXIS_INVERSE_LABELS_ORDER);
    lv_chart_set_y_tick_length(chart, 5, 8);


    lv_chart_refresh(chart); /*Required after direct set*/
}
In micropython web environment that is available from chart web page:
chart.set_margin(40)
won’t compile
Screenshot and/or video
If possible, add screenshots and/or videos about the current state.