What MCU/Processor/Board and compiler are you using?
I am using the micropython port on an ESP32 based board but also testing in the emulator
What LVGL version are you using?
The lastest micropython port (i believe its lvgl 7)
What do you want to achieve?
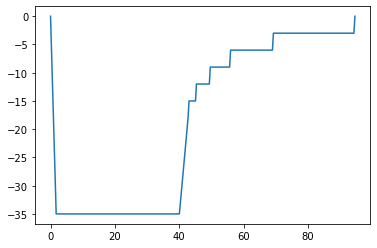
I would like to plot a chart with non sequential data using (x,y) values not just a sequence of x values, i.e plot the following data (0,0), (1,10), (5,10), (7,0). I have included an example below.
What have you tried so far?
I have tried using the emulator and reading the documentation but have not found a way to do this
Screenshot and/or video
As far as I know, you need to make up the ‘missed’ data points, so for your example (0,0), (1,10), (5,10), (7,0), you need to generate a series like this: (0,0), (1,10), (2, 10), (3, 10), (4, 10), (5,10), (6, 10), (7,0) to draw the chart.
Another option is to use Line() widget instead of Chart(). You can first draw an empty chart, so you have the chart background, then draw lines on top of that, but you need to align your lines with the chart background to match the ticks. This is the method I used in my project: https://github.com/dukeduck1984/uReflowOven-Esp32-Micropython . The green line is done with Line(), the red is done with Chart().