Hi,
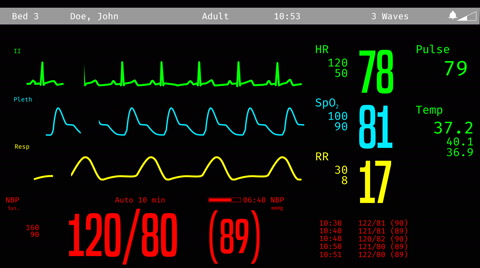
I’m currently working on a Patient Monitoring Project. I need to know whether I can make this kind of multi-chart in a single window. I’ve done a single chart in a window using LittleVGL but can we do multi-chart using LittleVGL??.
Hi,
I’m currently working on a Patient Monitoring Project. I need to know whether I can make this kind of multi-chart in a single window. I’ve done a single chart in a window using LittleVGL but can we do multi-chart using LittleVGL??.
You can create multiple chart objects and update them all at the same time.
Is there any demo file. I’ve searched but I didn’t found anything related to it.
There is a demo for a single chart object in the chart documentation. Depending on your needs, you can then create multiple series on the chart, or multiple chart objects.
Here is code that I just create for example of multi chart object:
/*
 * chart.c
 *
 *  Created on: Jan 6, 2020
 *      Author: teguh
 */

#include "chart.h"

static lv_obj_t * chart_one;
static lv_obj_t * chart_two;
static lv_obj_t * chart_three;

static lv_chart_series_t * ser_one;
static lv_chart_series_t * ser_two;
static lv_chart_series_t * ser_three;
static void chart_task(lv_task_t * param);

static char point_one = 0;
static char point_two = 0;
static char point_three = 0;

void chart_create(void){

	/*Create a chart one*/
	chart_one = lv_chart_create(lv_scr_act(), NULL);
	lv_obj_set_size(chart_one, 400, 100);
	lv_obj_align(chart_one, NULL, LV_ALIGN_IN_TOP_MID, 0, 0);
	lv_chart_set_type(chart_one, LV_CHART_TYPE_LINE);
	lv_chart_set_series_opa(chart_one, LV_OPA_70);
	lv_chart_set_series_width(chart_one, 4);
	lv_chart_set_range(chart_one, 0, 100);

	/*Create a chart two*/
	chart_two = lv_chart_create(lv_scr_act(), NULL);
	lv_obj_set_size(chart_two, 400, 100);
	lv_obj_align(chart_two, NULL, LV_ALIGN_CENTER, 0, 0);
	lv_chart_set_type(chart_two, LV_CHART_TYPE_LINE);
	lv_chart_set_series_opa(chart_two, LV_OPA_70);
	lv_chart_set_series_width(chart_two, 4);
	lv_chart_set_range(chart_two, 0, 100);

	/*Create a chart three*/
	chart_three = lv_chart_create(lv_scr_act(), NULL);
	lv_obj_set_size(chart_three, 400, 100);
	lv_obj_align(chart_three, NULL, LV_ALIGN_IN_BOTTOM_MID, 0, 0);
	lv_chart_set_type(chart_three, LV_CHART_TYPE_LINE);
	lv_chart_set_series_opa(chart_three, LV_OPA_70);
	lv_chart_set_series_width(chart_three, 4);
	lv_chart_set_range(chart_three, 0, 100);

	/*Create a series three*/
	ser_one = lv_chart_add_series(chart_one, LV_COLOR_RED);      /*Create a series one*/
	ser_two = lv_chart_add_series(chart_two, LV_COLOR_GREEN);    /*Create a series two*/
	ser_three = lv_chart_add_series(chart_three, LV_COLOR_BLUE); /*Create a series three*/

	/*Create task for filling the Charts*/
	lv_task_create(chart_task, 100, LV_TASK_PRIO_LOW, NULL);
}

static void chart_task(lv_task_t * param)
{
	(void) param;    /*Unused*/

	/*Summing point one*/
	point_one = point_one + 1;
	if(point_one > 100){
		point_one = 0;
	}

	/*Summing point two*/
	point_two = point_two + 2;
	if(point_two > 100){
		point_two = 0;
	}

	/*Summing point three*/
	point_three = point_three + 4;
	if(point_three > 100){
		point_three = 0;
	}

	lv_chart_set_next(chart_one, ser_one, point_one);       /*set point_one to next*/
	lv_chart_set_next(chart_two, ser_two, point_two);       /*set point_two to next*/
	lv_chart_set_next(chart_three, ser_three, point_three); /*set point_three to next*/

}
I hope the comment code is easily understandable for your reference.
Regards,
TJ.
Thanks! By the way, you can get rid of the backgrounds with lv_chart_set_style(chart, LV_CHART_STYLE_MAIN, &lv_style_transp).
It worked perfectly. Thanks for the immediate support.
hi i am working on same problem me discuss the functionally Email aniketkatoch@gmail.com