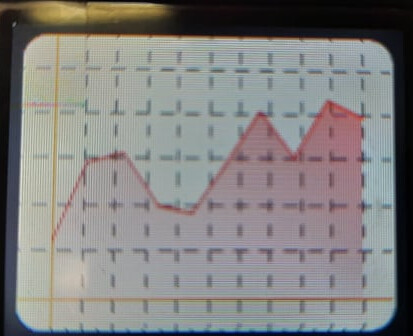
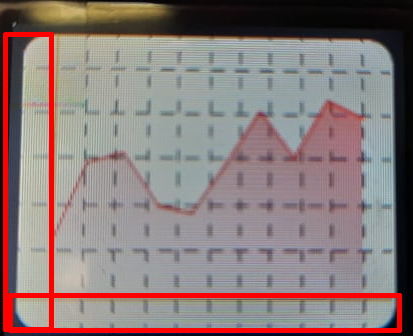
Is there any way to change the charts overlay?
To be precise I attach picture that shows which part I wish to cut off.
Area in red is the unwanted part of chart.


my code :
static void chart_callback(lv_event_t *event) {
	lv_obj_t *obj = lv_event_get_target(event);
	lv_obj_draw_part_dsc_t *dsc = lv_event_get_draw_part_dsc(event);

	/*Add the faded area before the lines are drawn*/
	if(dsc->part == LV_PART_ITEMS) {
		if(!dsc->p1 || !dsc->p2) return;

		/*Add a line mask that keeps the area below the line*/
		lv_draw_mask_line_param_t line_mask_param;
		lv_draw_mask_line_points_init(&line_mask_param, dsc->p1->x, dsc->p1->y, dsc->p2->x, dsc->p2->y, LV_DRAW_MASK_LINE_SIDE_BOTTOM);
		int16_t line_mask_id = lv_draw_mask_add(&line_mask_param, NULL);

		/*Add a fade effect: transparent bottom covering top*/
		lv_coord_t h = lv_obj_get_height(obj);
		lv_draw_mask_fade_param_t fade_mask_param;
		lv_draw_mask_fade_init(&fade_mask_param, &obj->coords, LV_OPA_COVER, obj->coords.y1 + h / 8, LV_OPA_TRANSP, obj->coords.y2);
		int16_t fade_mask_id = lv_draw_mask_add(&fade_mask_param, NULL);

		/*Draw a rectangle that will be affected by the mask*/
		lv_draw_rect_dsc_t draw_rect_dsc;
		lv_draw_rect_dsc_init(&draw_rect_dsc);
		draw_rect_dsc.bg_opa = LV_OPA_40;
		draw_rect_dsc.bg_color = dsc->line_dsc->color;

		lv_area_t a;
		a.x1 = dsc->p1->x;
		a.x2 = dsc->p2->x - 1;
		a.y1 = LV_MIN(dsc->p1->y, dsc->p2->y);
		a.y2 = obj->coords.y2;
		lv_draw_rect(dsc->draw_ctx, &draw_rect_dsc, &a);

		/*Remove the masks*/
		lv_draw_mask_free_param(&line_mask_param);
		lv_draw_mask_free_param(&fade_mask_param);
		lv_draw_mask_remove_id(line_mask_id);
		lv_draw_mask_remove_id(fade_mask_id);
	}
	/*Hook the division lines too*/
	else if(dsc->part == LV_PART_MAIN) {
		if(dsc->line_dsc == NULL || dsc->p1 == NULL || dsc->p2 == NULL) return;

		/*Vertical line*/
		if(dsc->p1->x == dsc->p2->x) {
			if(dsc->id == 0) {
				dsc->line_dsc->width = 1;
				dsc->line_dsc->dash_gap = 0;
				dsc->line_dsc->dash_width = 0;
				dsc->line_dsc->color = lv_palette_darken(LV_PALETTE_YELLOW, 3);
			} else {
				dsc->line_dsc->width = 1;
				dsc->line_dsc->dash_gap = 5;
				dsc->line_dsc->dash_width = 5;
				dsc->line_dsc->color = lv_palette_darken(LV_PALETTE_GREY, 3);
			}
		}
		/*Horizontal line*/
		else {
			if(dsc->id == 5) {
				dsc->line_dsc->width = 1;
				dsc->line_dsc->dash_gap = 0;
				dsc->line_dsc->dash_width = 0;
				dsc->line_dsc->color = lv_palette_darken(LV_PALETTE_YELLOW, 3);
			} else {
				dsc->line_dsc->width = 1;
				dsc->line_dsc->dash_gap = 5;
				dsc->line_dsc->dash_width = 5;
				dsc->line_dsc->color = lv_palette_darken(LV_PALETTE_GREY, 3);
			}
		}
	}
}

static void _get_GUI_SUBMENU_CHART_1(lv_event_t *event, lv_scr_load_anim_t direction) {
	lv_obj_t *chart = lv_chart_create(scr);
	lv_chart_series_t *ser1 = lv_chart_add_series(chart, lv_color_make(0xff, 0x00, 0x00), 						LV_CHART_AXIS_PRIMARY_Y);
	lv_obj_align(chart, LV_ALIGN_CENTER, 0, 0);
	lv_obj_set_size(chart, 150, 118);
	lv_obj_set_style_radius(chart, 1, LV_PART_INDICATOR);
	lv_obj_set_style_line_width(chart, 1, LV_PART_ITEMS);
	lv_obj_set_style_border_width(chart, 0, LV_PART_MAIN);
	lv_obj_add_event_cb(chart, chart_callback, LV_EVENT_DRAW_PART_BEGIN, NULL);
}
Thanks
Coffen