
Hi,When I debug my code,It always stop at the position as image shows and can not run,I dont know why? What it means?
What do you mean by “stops”? Does it crash? Do you get a fault?
The code freezes,I dont get a fault. Now It always stop at the position as image shows and can not run,I dont know why? What it means?

It seems like a memory corruption. Do you have any special things related to memory? E.g. external memory, custom malloc, etc.
Is it stops even if you don’t create any objects?
such is the case I have some custom malloc, It does not stop when i don’t create any objects. How do i deal with?
Exactly what happens when you step the debugger at that line?
I am trying to find the exact symptom.

Please show the disassembly view inside the lv_task_handler function.
![]()
I create a task for uart process. the problem just happen when I send a command from pc to the arm9 mcu.
I’m not sure that this is related to LittlevGL then - I suspect your uart_process may be corrupting something.
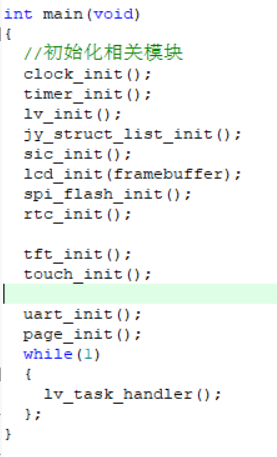
This is the lv_task_handler in the main().
No, I want the assembly code for lv_task_handler, not the C code. Your IDE should be able to show that.
But in light of your last comment, I think this is not necessarily a LittlevGL issue.


This appears to be outside the scope of LittlevGL and this forum.
You can retrieve the value with lv_bar_get_value. How you write it to NAND is not related to LittlevGL itself.
Thanks very much!! I learned much today. I will review my code.