I’ve made a chart following the “Display 1000 data points with zooming and scrolling” example. I’ve implemented the zoom feature in the same way as that example, but allowed to zoom in 20x instead of 10x.
When zooming in on the x-axis (horizontal zoom) LVGL by default will build the zoomed image to the right.
Ex. You are partially zoomed in on something, to the left you can scroll 20 pixels, to the right you can scroll 50. You zoom in more, now to the left you can scroll 20 pixels and to the right you can scroll 100. The left size stays fixed.
I wanted the opposite effect so I modified the slider_x_event_cb to look like this:
static void slider_x_event_cb(lv_event_t* e)
{
    lv_obj_t* obj = lv_event_get_target(e);
    int32_t v = lv_slider_get_value(obj);
    lv_coord_t right = lv_obj_get_scroll_right(chart);

    lv_chart_set_zoom_x(chart, v);
    lv_obj_scroll_to_x(chart, (lv_obj_get_scroll_left(chart) + lv_obj_get_scroll_right(chart)) - right, LV_ANIM_OFF)
}
And it works the way I intended.
I then also wanted to change the behaviour of the y-axis zoom (vertical), as it behaves the same as the horizontal, but swap the left pixels from the example above with top, and the right pixels with bottom. The behaviour I desired for the vertical zoom was for it to stay centered. So I modified the slider_y_event_cb to look like this:
static void slider_y_event_cb(lv_event_t* e)
{
    lv_obj_t* obj = lv_event_get_target(e);
    int32_t v = lv_slider_get_value(obj);

    lv_chart_set_zoom_y(chart, v);
    lv_obj_scroll_to_y(chart, (lv_obj_get_scroll_bottom(chart) + lv_obj_get_scroll_top(chart)) / 2, LV_ANIM_OFF);
}
And it also kind of works, the x-axis will bounce up and down by 1 pixel as you zoom in and out, I assume this is just rounding issues. Is there a better way to accomplish what I’m trying to do? Changing the fixed point about which the zoom occurs.
I’ve also noticed when I zoom in a lot there is a disconnect on my line graph, is this a known issue? I’ve put some images below.
Before zooming (chart with random data):
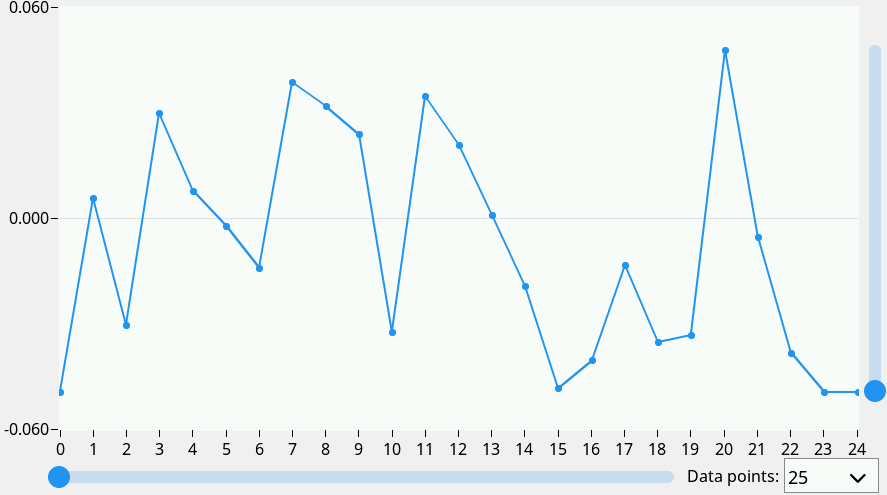
Chart after zooming vertically:
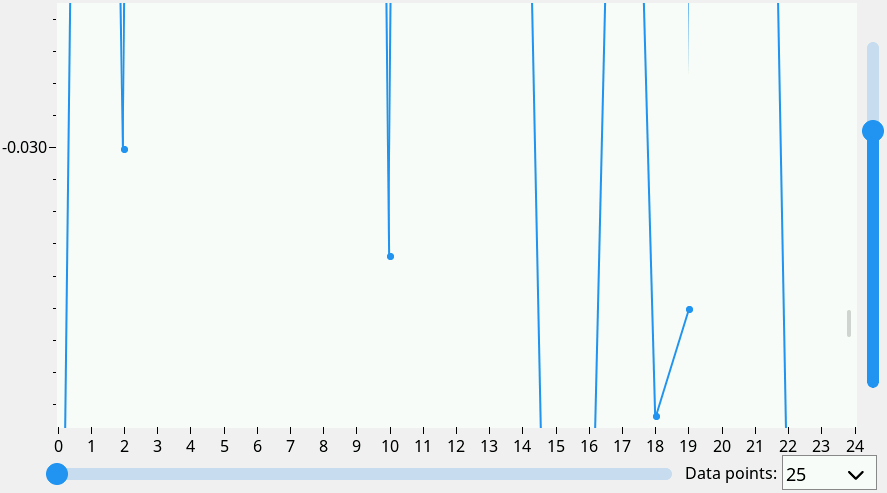
Points 19 and 20 have a disconnect after zooming in.