Description
What MCU/Processor/Board and compiler are you using?
What LVGL version are you using?
v 9.0.0
What do you want to achieve?
What have you tried so far?
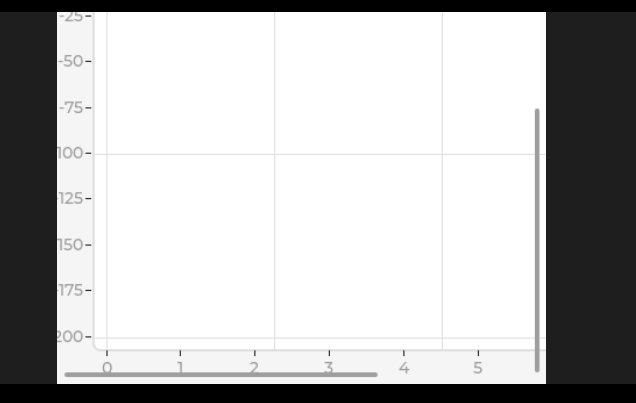
I am noticing an issue with X axis ticks not appearing. The Y axis works absolutely alright for me. The lvgl chart type I am using is none and I am using setting the data range for the x axis as 0 to 50000
This is a small snippet of my code -
/* Create a pl_gui_fft_chart for displaying axises (not for actual data display) */
chart = lv_chart_create(parent);
lv_chart_set_type(chart, LV_CHART_TYPE_NONE);
lv_obj_set_size(chart, 600, 340);
lv_obj_set_pos(chart, 30, 50);
lv_chart_set_range(chart,
	LV_CHART_AXIS_PRIMARY_X,
	0,
	25000);
lv_chart_set_axis_tick(chart,
	LV_CHART_AXIS_PRIMARY_X,
	5,
	0,
	10,
	1,
	true,
	50);

/* Display labels on x and y axises */
lv_chart_set_axis_tick(chart,
	LV_CHART_AXIS_PRIMARY_Y,
	5,
	0,
	9,
	1,
	true,
	100);

/* Set the x and y axises range (input data range) */
lv_chart_set_range(chart,
	LV_CHART_AXIS_PRIMARY_Y,
	-200,
	0);

lv_chart_refresh(chart);
This same snippet however works if the chart type is changed to Scatter. Have checked with the simulator as well and the x axis ticks are coming as 0 1 2 3 4 and so on
Code to reproduce
Add a code snippet which can run in the simulator. It should contain only the relevant code that compiles without errors when separated from your main code base.
The code block(s) should be formatted like:
/*You code here*/
import lvgl as lv

import display_driver

# Initialize LVGL

lv.init()

# Create a screen object

scr = lv.obj()

# Create a chart object

chart = lv.chart(scr)

chart.set_size(600, 340)

chart.set_pos(30, 50)

chart.set_type(lv.chart.TYPE.NONE) # Set chart type to NONE

# Set the X and Y axis ranges

chart.set_range(lv.chart.AXIS.PRIMARY_X, 0, 50000)

chart.set_range(lv.chart.AXIS.PRIMARY_Y, -200, 0)

# Set axis ticks (this may need adjustments)

chart.set_axis_tick(lv.chart.AXIS.PRIMARY_X, 5, 0, 10, 1, True, 50)

chart.set_axis_tick(lv.chart.AXIS.PRIMARY_Y, 5, 0, 9, 1, True, 100)

# Add a dummy series to trigger X-axis scaling

dummy_ser = chart.add_series(lv.color_hex(0xFF0000), lv.chart.AXIS.PRIMARY_Y)

chart.set_next_value(dummy_ser, 0)

chart.set_next_value(dummy_ser, 50000)

# Force refresh

chart.invalidate()

# Load the screen

lv.scr_load(scr)
Screenshot and/or video
If possible, add screenshots and/or videos about the current state.
This is a SS from the simulator