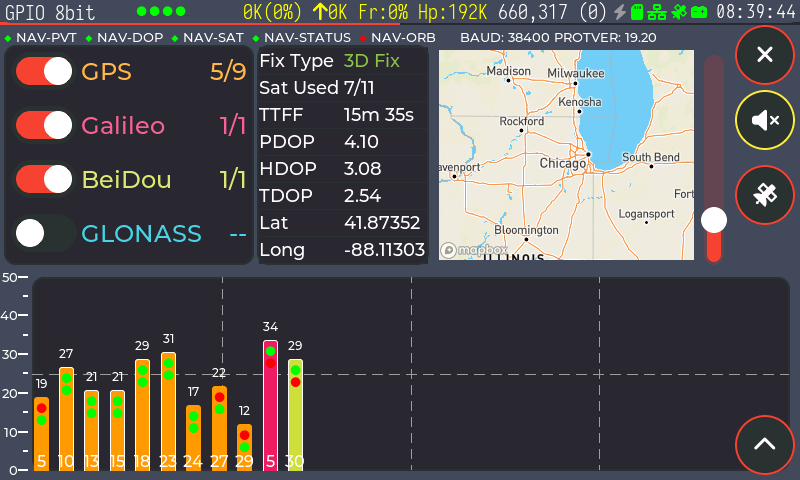
Interestingly enough, I was migrating code this weekend from LVGL 8->9 to do a similar task (LVGL bar chart showing satellite cno and other status info). Here’s a screenshot:
Briefly, you can set the chart padding to alter the bar width / spacing. This is what I have:
  //Padding of chart
  lv_obj_set_style_pad_all(gnss_chtSignal, 0, LV_PART_MAIN | LV_STATE_DEFAULT);
  //Padding to make series bars wider
  lv_obj_set_style_pad_gap(gnss_chtSignal, -7, LV_PART_ITEMS | LV_STATE_DEFAULT);
Then this is where it gets a little tricky, at least for me - LVGL has a lot of good stuff for overriding widget draw events, but the written documentation is virtually non-existent, you have to rely on example code as documentation and, sadly, some of those examples have bugs in them, such as incorrect typing of variables that co-incidentally work for the example, but not if you expand upon them… I can give you pointers and share my working code, but I’m still figuring it all out too, so it may not be optimal and I may not be able to provide more info 
I enhance the chart with the following -
- Color of the bar, showing which GNSS it belongs to
- Border color of bar, indicating if the satellite is in-use for the fix (white), or not (black)
- CNO displayed at the top of the bar
- Circles indicating if the ephemeris and almanac data have been downloaded (green) or not (red)
- Satellite vehicle ID added to the bottom part of the bar (needs some more work)
I add these events to my chart:
lv_obj_add_event_cb(gnss_chtSignal, gnss_chtSignal_draw_event_cb, LV_EVENT_DRAW_TASK_ADDED, NULL);
lv_obj_add_event_cb(gnss_chtSignal, gnss_chtSignal_draw_event_cb, LV_EVENT_DRAW_POST_END, NULL);
lv_obj_add_flag(gnss_chtSignal, LV_OBJ_FLAG_SEND_DRAW_TASK_EVENTS);
and then implement the callback like this:
void gnss_chtSignal_draw_event_cb(lv_event_t * e)
{
  lv_event_code_t event = lv_event_get_code(e);
  lv_obj_t * obj = (lv_obj_t *)lv_event_get_target(e);

  if (event == LV_EVENT_DRAW_TASK_ADDED) {

    lv_draw_task_t * draw_task = lv_event_get_draw_task(e);
    lv_draw_dsc_base_t * base_dsc = (lv_draw_dsc_base_t *)lv_draw_task_get_draw_dsc(draw_task);

    if(base_dsc->part == LV_PART_ITEMS) {
      uint16_t dscId = base_dsc->id2;
      if (gnss_svInfo[dscId].cno > 0) {
        //Change color/border of bar depending on GNSS and if SV is in use
        if (lv_draw_task_get_type(draw_task) == LV_DRAW_TASK_TYPE_FILL) {
          lv_draw_fill_dsc_t * fill_dsc = lv_draw_task_get_fill_dsc(draw_task);
          if(fill_dsc) {
            fill_dsc->color = lv_palette_main(gnss_color[gnss_svInfo[dscId].gnssId]);
          }
        }
        if (lv_draw_task_get_type(draw_task) == LV_DRAW_TASK_TYPE_BORDER) {
          lv_draw_border_dsc_t * border_dsc = lv_draw_task_get_border_dsc(draw_task);
          if (border_dsc) {
            border_dsc->width = gnss_svInfo[dscId].bInUse == true ? 1 : 0;
            border_dsc->color = gnss_svInfo[dscId].bInUse == true ? lv_color_white() : lv_color_black();
          }
        }
      }
    }
  }
  if (event == LV_EVENT_DRAW_POST_END) {
    lv_layer_t * layer = lv_event_get_layer(e);
    const char sensorDotBuf[4] = "●";
    char buf[16];

    for (uint16_t i=0; i<ARRAY_SIZE(gnss_svInfo); i++) {
      if (gnss_svInfo[i].cno > 0) {
        lv_area_t chart_obj_coords;
        lv_obj_get_coords(obj, &chart_obj_coords);
        lv_point_t p;
        lv_chart_get_point_pos_by_id(obj, lv_chart_get_series_next(obj, NULL), i, &p);

        //Draw signal at top of bar
        lv_snprintf(buf, sizeof(buf), LV_SYMBOL_DUMMY"%d", gnss_svInfo[i].cno);
        drawTextOnLayer(buf, layer, &p, &chart_obj_coords, lv_color_white(), lv_fontTiny, 15);

        lv_snprintf(buf, sizeof(buf), LV_SYMBOL_DUMMY"%s", sensorDotBuf);

        //Draw circle below top of bar to represent ephemeris status
        drawTextOnLayer(buf, layer, &p, &chart_obj_coords, gnss_svInfo[i].bEphAvail == true ? okStatusColorLV : errorStatusColorLV, lv_sensorDotFont, -10);

        //Draw circle below top of bar to represent almanac status
        drawTextOnLayer(buf, layer, &p, &chart_obj_coords, gnss_svInfo[i].bAlmAvail == true ? okStatusColorLV : errorStatusColorLV, lv_sensorDotFont, -22);

        //Draw SVID in bar
        lv_snprintf(buf, sizeof(buf), LV_SYMBOL_DUMMY"%d", gnss_svInfo[i].svId);
        drawTextOnLayer(buf, layer, &p, &chart_obj_coords, lv_color_white(), lv_fontSmall, (chart_obj_coords.y1 + p.y) - chart_obj_coords.y2 + 10);
      }
    }
  }
}

void drawTextOnLayer(const char * text, lv_layer_t * layer, lv_point_t * p, lv_area_t * coords, lv_color_t color, const void * font, int16_t offset)
{
  lv_draw_rect_dsc_t draw_rect_dsc;
  lv_draw_rect_dsc_init(&draw_rect_dsc);

  //draw_rect_dsc.bg_color = lv_color_black();
  draw_rect_dsc.bg_opa = LV_OPA_TRANSP;
  draw_rect_dsc.radius = 0;
  draw_rect_dsc.bg_image_symbol_font = font;
  draw_rect_dsc.bg_image_src = text;
  draw_rect_dsc.bg_image_recolor = color;

  lv_area_t a;
  a.x1 = coords->x1 + p->x - 10;
  a.x2 = coords->x1 + p->x + 10;
  a.y1 = coords->y1 + p->y + 10 - offset;
  a.y2 = a.y1 - 20;

  lv_draw_rect(layer, &draw_rect_dsc, &a);
}
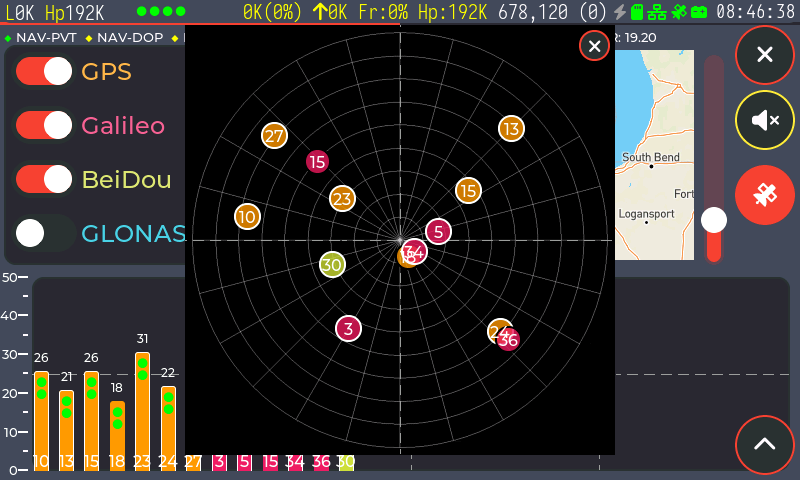
Pick that apart and hope it helps  I also use an lv_chart scatter chart to show satellite positions in the sky. I think it works:


