Description
Hello,i want to know how to hide the points in the chart?
What MCU/Processor/Board and compiler are you using?
visual studio simulator
What LVGL version are you using?
v9.2
What do you want to achieve?
The offical documentation:
![]()
Is that means these points will always be there and you can only change the style?
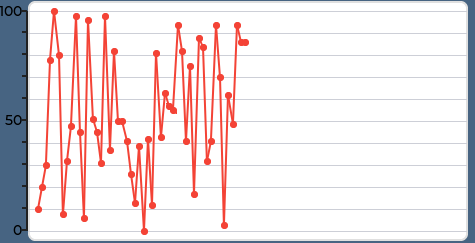
But I saw the examples,lv_example_chart_8():
this was perfect, lines only without points,and then I copy the code, run it:
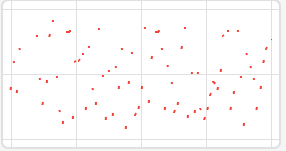
Lines disappeared.
What have you tried so far?
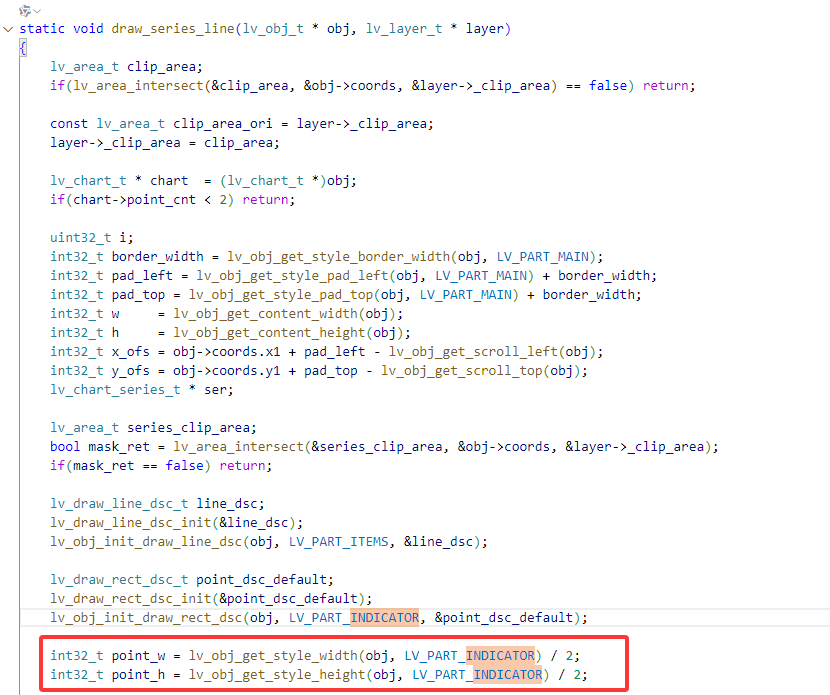
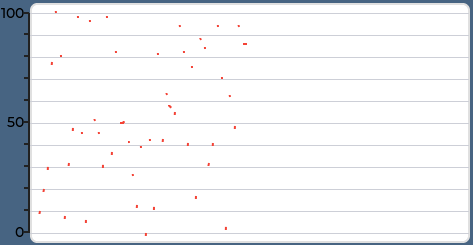
lv_obj_set_style_size(chart, 0, 0, LV_PART_INDICATOR);
or
static lv_style_t style_indic;
lv_style_init(&style_indic);
lv_style_set_radius(&style_indic, 0);
lv_style_set_size(&style_indic, 0);
lv_obj_add_style(chart, &style_indic, LV_PART_INDICATOR);
These all made the lines disappeared.
Is there any other way?
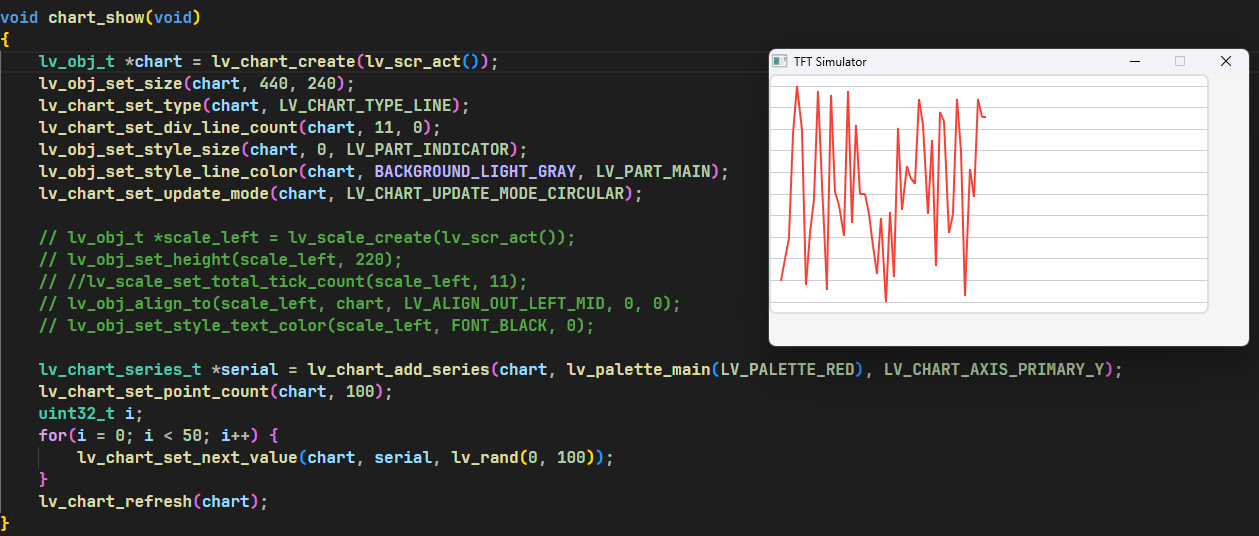
Code to reproduce
   lv_obj_t *chart = lv_chart_create(lv_screen_active());
    lv_obj_set_size(chart, 440, 240);
    lv_chart_set_type(chart, LV_CHART_TYPE_LINE);
    lv_chart_set_div_line_count(chart, 11, 0);
    // lv_obj_set_style_size(chart, 0, 0, LV_PART_INDICATOR);
    lv_obj_set_style_line_color(chart, BACKGROUND_LIGHT_GRAY, LV_PART_MAIN);
    lv_chart_set_update_mode(chart, LV_CHART_UPDATE_MODE_CIRCULAR);

    lv_obj_t *scale_left = lv_scale_create(lv_screen_active());
    lv_obj_set_height(scale_left, 220);
    lv_scale_set_mode(scale_left, LV_SCALE_MODE_VERTICAL_LEFT);
    lv_scale_set_total_tick_count(scale_left, 11);
    lv_obj_align_to(scale_left, chart, LV_ALIGN_OUT_LEFT_MID, 0, 0);
    lv_obj_set_style_text_color(scale_left, FONT_BLACK, 0);

    serial = lv_chart_add_series(chart, lv_palette_main(LV_PALETTE_RED), LV_CHART_AXIS_PRIMARY_Y);
    lv_chart_set_point_count(chart, 100);
    uint32_t i;
    for(i = 0; i < 50; i++) {
        lv_chart_set_next_value(chart, serial, lv_rand(0, 100));
    }
    lv_chart_refresh(chart);
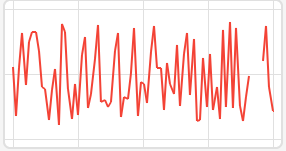
Almost the same code in v8.3
So, in v9 how to make it?
Screenshot and/or video