Lv_chart fractional values for points

There are some functions to set up series points coordinates

void lv_chart_set_ext_y_array(lv_obj_t * obj, lv_chart_series_t * ser, lv_coord_t array[])
void lv_chart_set_ext_x_array(lv_obj_t * obj, lv_chart_series_t * ser, lv_coord_t array[])

They are uses lv_coord_t array, which are integers.
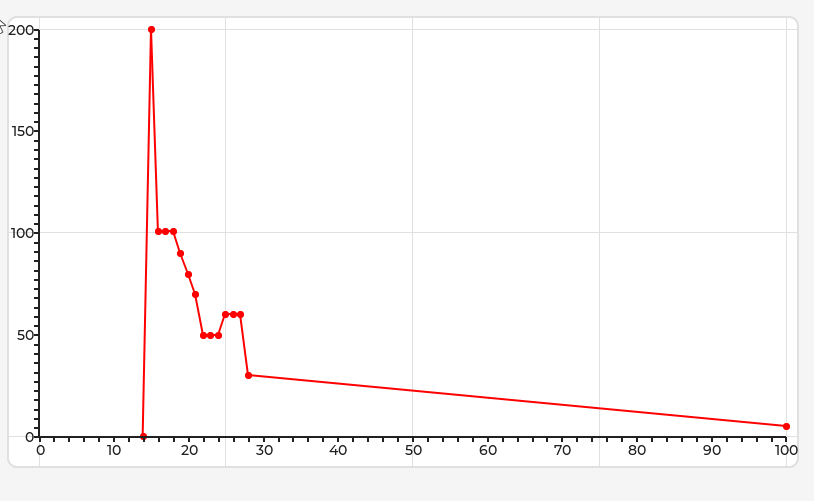
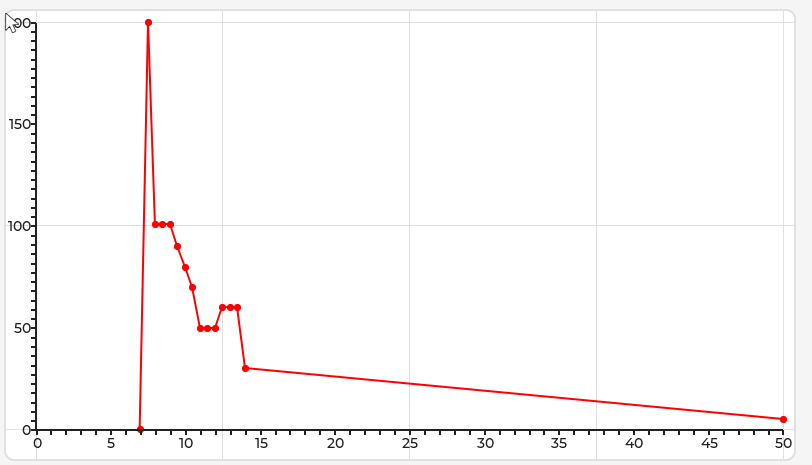
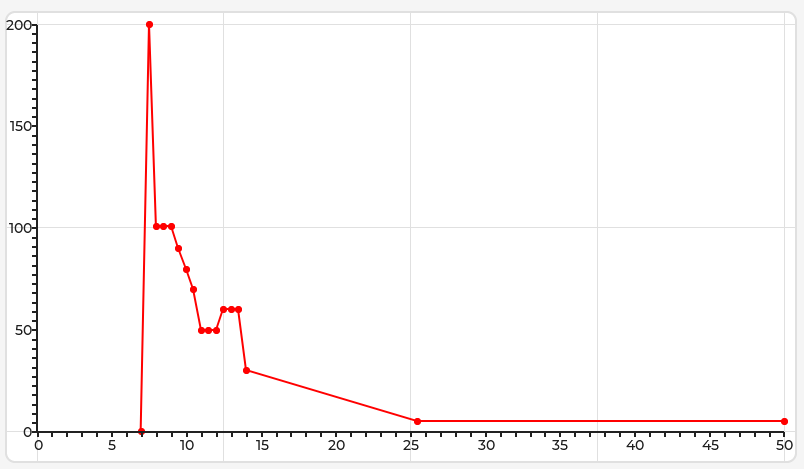
Is it possible to set fractional values ​​for the X-axis on the chart (x=5.5, x=10.5)?

Or maybe there is some way to set up the graph so that the points are specified as integers, but displayed on the graph as fractions. Ыimilar to that, I set an array containing x = 0, 5, 10, 15, and on the chart they were displayed at points 0, 0.5, 1

Environment

  • MCU/MPU/Board:
  • LVGL version: See 8.4.0

Hi

You (the user) define the scale, when setting up the charts we define the max x scale value with lv_chart_set_range, and also the “Y” range lv_chart_set_point_count for a simple line chart… since the chart object only accepts int32 values.

Internally the chart object is basically doing interpolation between the chart object height and the Y defined range (max and min value) to determine where to draw the line/point.

With this, the user needs to scale the values as required, especially if it wants to show “decimal” values.

For example, it the scale is to be from 0 ~ 100 and you want resolution (or the possibility to view data in 0.5 increments), it would be necessary to set the X scale to max = 200, and to properly scale-up the data before setting with lv_chart_set_next_value or lv_chart_set_ext_x_array, in this case it would be necessary to multiply the raw data by 2 to have the correct scaling.

Obviously in this case the chart object would need to have at least 200 pixels in height in order to be able to render the points correctly.

NOTE: I guess from the documentation in V8, the chart itself had the ability to show the scale and respective labels, have not used v8 in a long time, so not sure how it works if the user wants to have scale labels like 0.5, guess it will be necessary to have an event draw_event_cb and check for the draw part be LV_CHART_DRAW_PART_TICK_LABEL for the x axis to override the text, in v9 the user needs to draw the scale separately with the scale obj by doing so we can draw the scale however we “want” even with decimal values with lv_scale_set_text_src.

it seems you proposal doesn’t work. following code gives me a series started x = 14, ended at x = 31.

const lv_coord_t y_ar[200] = {   0, 100, 101, 101, 101,  90,  80,  70,  50,  50,  50,  60,  60,  60,  30,  5 };
const lv_coord_t x_ar[200] = {  14,  15,  16,  17,  18,  19,  20,  21,  22,  23,  24,  25,  26,  27,  28,  31};
.....

  lv_chart_set_type(сhart, LV_CHART_TYPE_SCATTER);
  lv_chart_set_range(chart, LV_CHART_AXIS_PRIMARY_X, 0, 100);
  lv_chart_set_range(chart, LV_CHART_AXIS_PRIMARY_Y, 0, 200);
  lv_chart_set_point_count(chart, 200);

  lv_chart_set_ext_y_array(chart, ser, (lv_coord_t*)y_ar);
  lv_chart_set_ext_x_array(chart, ser, (lv_coord_t*)x_ar);

Sorry, don’t have any easy way to test in v8…

But in v9, it shows like this, that seems “correct” (Added a scale in X and Y):

with this code:


const lv_coord_t y_ar[] = {   0, 200, 101, 101, 101,  90,  80,  70,  50,  50,  50,  60,  60,  60,  30,  5 };
const lv_coord_t x_ar[] = {  14,  15,  16,  17,  18,  19,  20,  21,  22,  23,  24,  25,  26,  27,  28,  100};

lv_chart_set_type(objects.test_chart1, LV_CHART_TYPE_SCATTER);
lv_chart_set_range(objects.test_chart1, LV_CHART_AXIS_PRIMARY_X, 0, 100);
lv_chart_set_range(objects.test_chart1, LV_CHART_AXIS_PRIMARY_Y, 0, 200);
lv_chart_set_point_count(objects.test_chart1, sizeof(x_ar) / sizeof(x_ar[0]));


lv_chart_series_t *ser = lv_chart_add_series(objects.test_chart1, lv_color_hex(0xff0000), LV_CHART_AXIS_PRIMARY_Y);

lv_chart_set_ext_y_array(objects.test_chart1, ser, (lv_coord_t*)y_ar);
lv_chart_set_ext_x_array(objects.test_chart1, ser, (lv_coord_t*)x_ar);

I changedd the second point y to be full scale (200), and also changed the last point x to be full scale (100).

so first point of series on chart is (14; 0) not (7;0)

Can you place a point at coordinates (14.5; 90)?

Well, yes. If the chart is defined as having a range in Y axis of 0~100, the first point is going to be placed at that position, and the “scale” was also defined to be 0~100…

We can always “adjust” the scale (this in V9 is “simple” since the scale is handled by “us”, in V8 should be possible also by using the draw_event_cb to customize the labels on the scale)

The chart code is exactly the same, just the “ui” for the user that is different.

In C Code prespective, the values in the X axis are multiplied by 2… the range of data supplied to the chart is 0~100 that in reality represent values from 0~50.

You can have the range for X as 0~100, and then adjust the “scale” labels to show whatever is required for the user, you just need to scale the value passed to the chart correctly.

Can you place a point at coordinates (14.5; 90)?

Yes, I can, if we are assuming that the “ui” (in user perspective) of the chart is only from 0~50, i can add a point. I added to appear at X=25.5; U = 5, to be more noticeable

Updated array:

const lv_coord_t y_ar[] = {   0, 200, 101, 101, 101,  90,  80,  70,  50,  50,  50,  60,  60,  60,  30,  5, 5 };
const lv_coord_t x_ar[] = {  14,  15,  16,  17,  18,  19,  20,  21,  22,  23,  24,  25,  26,  27,  28,  51, 100};

I understand this idea. Maybe someone has other suggestions?