Low FPS and no logs lv_platformio

Hardware + software:

  • win 10
  • lv_platformio simulator
  • lvgl 9.3

I use the LVGL simulator from here

I don’t use a configuration file, I set all flags in platformio.ini

[env]
build_flags =

; Don’t use lv_conf.h. Tweak params via platfom.ini.
-D LV_CONF_SKIP
-D LV_CONF_INCLUDE_SIMPLE
-D LV_FONT_MONTSERRAT_12=1
-D LV_USE_LOG=1

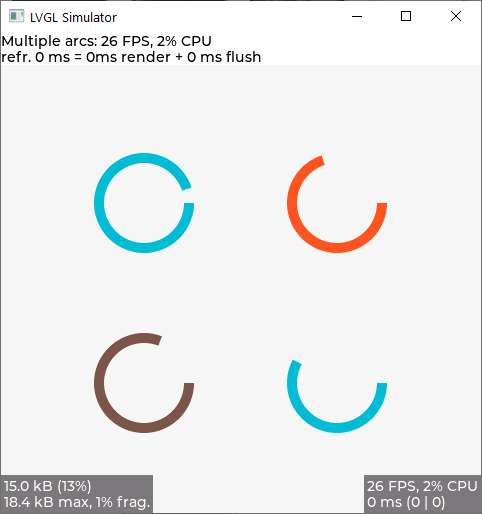
The first oddity is the maximum FPS is 26, even in the benchmark:

The second oddity is that I can’t output LOGs, although they should work with the flag:

-D LV_USE_LOG=1

Never used it, didn’t know it exists… quick way to have the simulator working in windows while the vscode one doesn’t support Windows correctly…

Regarding the Log, you need to comment this line Line 35 in app_hal.c otherwise the log will not use printf but the callback… and the callback is not implemented…

Also pay attention to log level, the default is LV_LOG_LEVEL_WARN and is quite most of the time…

    #if LV_USE_LOG != 0
    //lv_log_register_print_cb(lv_log_print_g_cb);
    #endif

Regarding the FPS, you need to add the platformio.ini

-D LV_DEF_REFR_PERIOD=10

For example to get 100FPS, and also you need to reduce the value used to delay the main loop → lv_platformio/hal/sdl2/app_hal.c at 7b6b7b2d0cceb449292dde1fe69e37d97d70d86a · lvgl/lv_platformio · GitHub

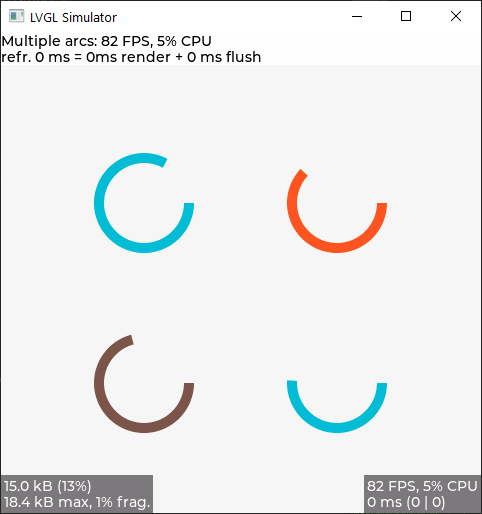
If add the new “define” and reduce the delay to 1, you get almost 100FPS (this in my PC)…

Not sure why the LV_DEF_REFR_PERIOD is influencing the FPS, but the latest’s hardware i have been using are barely able to get 30FPS, i thought that this would not have influence in benchmark but so many discussions/alterations where made in the benchmark / way to measure FPS that I don’t know…

If you want more FPS, just decrease the LV_DEF_REFR_PERIOD and eventually change the main loop to something like this:

void hal_loop(void)
{
    Uint32 lastTick = SDL_GetTicks();
    while(1) {
        //SDL_Delay(1);
        Uint32 current = SDL_GetTicks();
        if(current - lastTick >= 1){
            lv_tick_inc(current - lastTick); // Update the tick timer. Tick is new for LVGL 9
            //printf("Tick: %d\n", current - lastTick);
            lastTick = current;
        }
        lv_timer_handler(); // Update the UI-
    }
}

It gives a bit more of FPS…

You helped :grinning:

It didn’t help:

SDL_Delay(1);

It helped:

-D LV_DEF_REFR_PERIOD=10

It’s just not entirely clear whether this is a scam of a real FPS or a real one?

Visually, the benchmark did not become faster :roll_eyes:

No ideia if there are some limitations in SDL2 when showing data on screen or other stuff…

The FPS number, is suppose to be the number of frames that LVGL was able to design, not sure if it includes only frames where something was designed or if an attempt to design also counts, even if nothing was to be updated, i would say is the latter since when you finish the benchmark for example and there is nothing to update on the screen you get the 100FPS (derived from LV_DEF_REFR_PERIOD) and probably most of the stuff happening in the screen is based on animations / delays that are somewhat constant, the difference may be that if you are bellow 25~30FPS you start noticing staggering/hiccups/delays in the screen, that you typically see when testing in real hardware, not a PC, but a Hardware board with STM32@80MHz or even an ESP32, although most of the times the slowness perceived is not entirely related to LVGL/CPU but with the Display driver, that was one of the reasons for the timings show next to the FPS Counter be two numbers, render time + flush time.

But there are other people around that a better understanding of the FPS and if it matters that much

In my opinion as long in real hardware during screen transitions / Widgets animations I am not lower that 20FPS it looks good, and most of the time the real gains are in the display driver flush_cb than necessarily on LVGL / User GUI Code, in one of my last projects there where two things that significantly speed up the display update / perception of high FPS, one of them was realizing that the ESP32 SPI DMA buffers max size is 32KB and that is more beneficial to have your partial buffer at that size than larger (although this was not enterally related to performance but also with RAM utilization), the other was that enabling the option to copy FLASH Data and Code to SPIRAM (CONFIG_SPIRAM_FETCH_INSTRUCTIONS and CONFIG_SPIRAM_RODATA) and execute everything from there was way faster…

1 Like

Yes, I understand the difference between the simulator and real hardware.
Could you show your flush_cb code for the esp32 microcontroller?

Tell me how this information can help:

[Trace] (19.736, +0) event_send_core: Sending event 30 to 00007ff73bf19530 with 00007ff73bf18050 param lv_obj_event.c:353
[Trace] (19.736, +0) event_send_core: Sending event 28 to 00007ff73bf19938 with 00007ff73bf18050 param lv_obj_event.c:353
[Trace] (19.736, +0) event_send_core: Sending event 29 to 00007ff73bf19938 with 00007ff73bf18050 param lv_obj_event.c:353
[Trace] (19.736, +0) lv_malloc_zeroed: allocating 264 bytes lv_mem.c:94
[Trace] (19.736, +0) lv_malloc_zeroed: allocated at 00007ff73bf1b798 lv_mem.c:115
[Trace] (19.736, +0) lv_free: freeing 00007ff73bf1b5c0 lv_mem.c:132
[Trace] (19.736, +0) lv_malloc_zeroed: allocating 272 bytes lv_mem.c:94
[Trace] (19.736, +0) lv_malloc_zeroed: allocated at 00007ff73bf1b5c0 lv_mem.c:115
[Trace] (19.736, +0) lv_free: freeing 00007ff73bf1b798 lv_mem.c:132
[Trace] (19.736, +0) lv_malloc_zeroed: allocating 40 bytes lv_mem.c:94
[Trace] (19.736, +0) lv_malloc_zeroed: allocated at 00007ff73bf1b6d8 lv_mem.c:115
[Trace] (19.809, +73) lv_malloc: allocating 131 bytes lv_mem.c:64
[Trace] (19.809, +0) lv_malloc: allocated at 00007ff73bf1b798 lv_mem.c:88
[Trace] (19.809, +0) lv_free: freeing 00007ff73bf1b798 lv_mem.c:132
[Trace] (19.809, +0) lv_free: freeing 00007ff73bf1b6d8 lv_mem.c:132
[Trace] (19.809, +0) event_send_core: Sending event 30 to 00007ff73bf19938 with 00007ff73bf18050 param lv_obj_event.c:353

I set the flag:
-D LV_LOG_LEVEL=LV_LOG_LEVEL_TRACE

Information from the log as an example, I’m just interested in what is needed and can be found out from the logs.
Should I enable the TRACE flag or is INFO enough?
I already know that to draw a large number of canvases I need a LV_MEM_SIZE value greater than 128.
For example, if I specify the flag:

-D LV_LOG_LEVEL=LV_LOG_LEVEL_WARN

Then I get the following log:

[Warn] (0.222, +222) lv_draw_buf_create_ex: No memory: 130x190, cf: 16, stride: 520, 98800Byte, lv_draw_buf.c:325
[Warn] (0.222, +0) lv_draw_layer_alloc_buf: Allocating layer buffer failed. Try later lv_draw.c:479

For me now the log is just a lot of unnecessary information.
But I would like to use it for its intended purpose :grinning:

My flush_cb is quite standard, in case of ESP32 if you are using the component esp_lcd_panel it’s quite easy to get it mostly right…

static void Display_lvgl_flush_cb(lv_display_t *disp, const lv_area_t *area, uint8_t *px_map)
{
    lv_draw_sw_rgb565_swap(px_map, lv_area_get_size(area));
    esp_lcd_panel_handle_t panel_handle = (esp_lcd_panel_handle_t)lv_display_get_user_data(disp);
    lvgl_spi_transaction_in_progress = true;
    esp_lcd_panel_draw_bitmap(panel_handle, area->x1, area->y1, area->x2+ 1, area->y2+ 1, px_map);
}

What i mean with:

and most of the time the real gains are in the display driver flush_cb than necessarily on LVGL / User GUI Code

Is that some examples over the internet are in reality very bad examples, from using a single partial buffer, and/or having double buffer but having the flush_cb to stall the processor while the transfer is done removing the advantages of using double buffer, incorrect driver configuration (specially in SPI LCDs, mostly due to clock settings or lack of DMA utilization). Most of them come directly from manufacturers, but it’s important to realize that most the example code from most manufacturers (chip or boards makers) are only as good as a proof of concept that it “works”, but not necessarily in the most optimal way.

Regarding the logs, i don’t know what kind of information/use you what to get from them, but would say that having the level set to LV_LOG_LEVEL_TRACE is only required if having serious problems, it generates a lot of info and it’s quite tricky to filter what matters and sometimes the hardware becomes so slow because of all the prints that generates other problems… Typically only use LV_LOG_LEVEL_WARN and eventually LV_LOG_LEVEL_INFO if more information is required

The last example you have is more interesting with the LV_LOG_LEVEL_WARN, it gives you detail that your LV_MEM_SIZE is too low, since memory allocation has failed, LVGL is trying to allocate a buffer with total size of almost 100KB, it seems that your LV_MEM_SIZE needs to be way bigger.

These logs are useful, since you can check which file/line have generated the error and then browse the code to check if it possible to better understand the reason, or adding extra logs details. If you have LV_LOG_LEVEL_TRACE you will get more information, but you need to place the all the logs printed in a text editor to more easily find where the warning lv_draw_buf_create_ex: No memory: 130x190, cf: 16, stride: 520, 98800Byte, lv_draw_buf.c:325 line is, to check the previous logs lines to possibly get some extra details, it’s quite tricky to debug using logs, specially because we don’t know for sure which widget was being refreshed at that time that generated the warning/error, a bit of detective work and/or being able to a have a smaller “example” having the same behaviour…
1 Like