Description
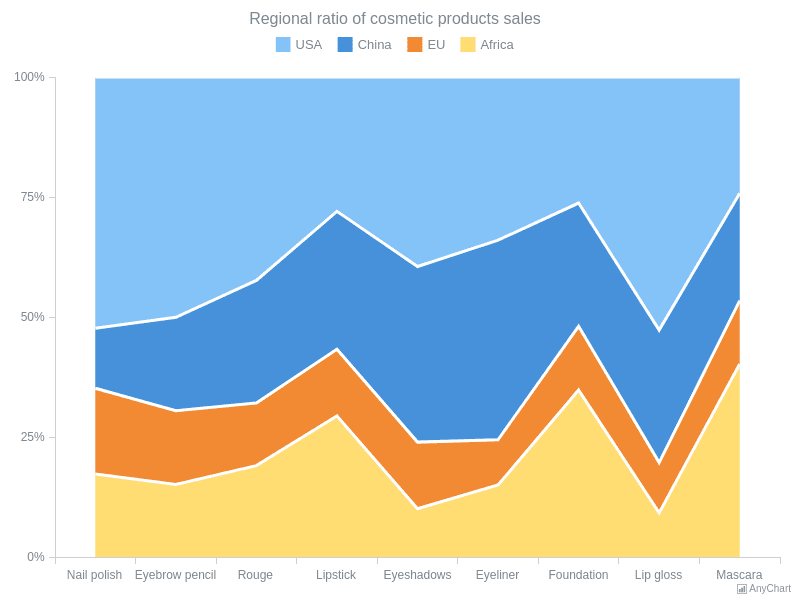
I am trying to create a stacked area chart with to show percentages like so:
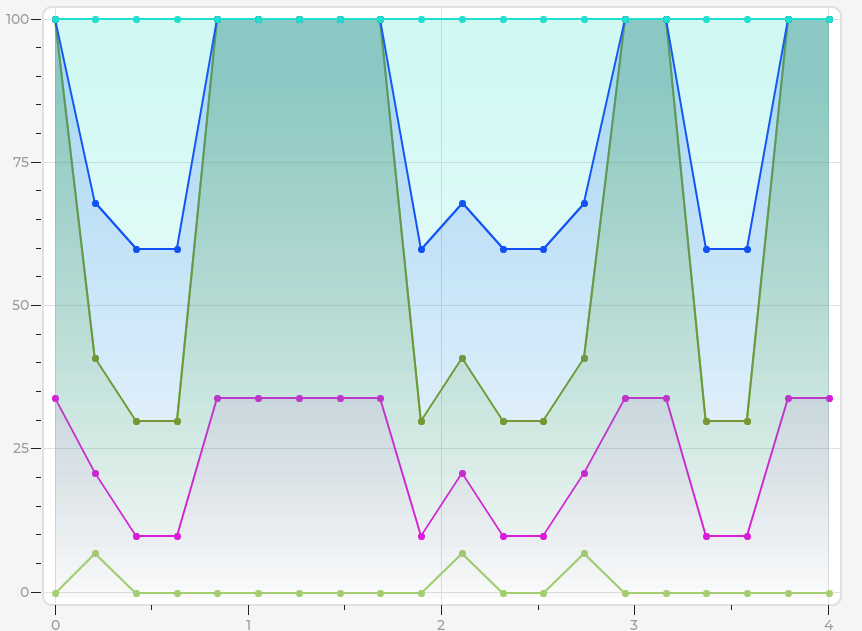
I have used the line masking described in an example in the docs to make the gradient effect and acheived this:
Although this seems to work the colours are a bit off and sort of blend in to each other. Would it be possible to use masking to create solid block colours instead of gradients?
What MCU/Processor/Board and compiler are you using?
Simulator
What LVGL version are you using?
v8.11
What do you want to achieve?
Block colours between two lines on a chart
What have you tried so far?
I have tried altering the masks without much success. Looking for some guidance.
Code to reproduce
Just the draw event callback described in the example here
Screenshot and/or video
See above
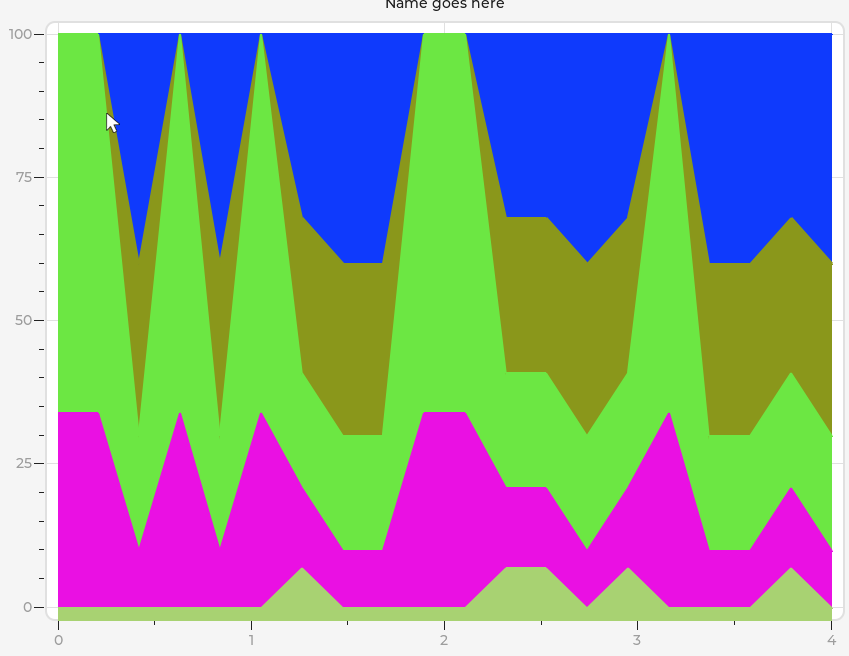
This should get you started. You’ll need to tinker with the Z-order of the series so they don’t overlap strangely, but the solid effect seems to work with these quick tweaks:
static lv_obj_t * chart1;
static lv_chart_series_t * ser1;
static lv_chart_series_t * ser2;

static void draw_event_cb(lv_event_t * e)
{
    lv_obj_t * obj = lv_event_get_target(e);

    /*Add the faded area before the lines are drawn*/
    lv_obj_draw_part_dsc_t * dsc = lv_event_get_draw_part_dsc(e);
    if(dsc->part == LV_PART_ITEMS) {
        if(!dsc->p1 || !dsc->p2) return;

        /*Add  a line mask that keeps the area below the line*/
        lv_draw_mask_line_param_t line_mask_param;
        lv_draw_mask_line_points_init(&line_mask_param, dsc->p1->x, dsc->p1->y, dsc->p2->x, dsc->p2->y, LV_DRAW_MASK_LINE_SIDE_BOTTOM);
        int16_t line_mask_id = lv_draw_mask_add(&line_mask_param, NULL);

        /* embeddedt note: fade mask not needed */

        /*Draw a rectangle that will be affected by the mask*/
        lv_draw_rect_dsc_t draw_rect_dsc;
        lv_draw_rect_dsc_init(&draw_rect_dsc);
        draw_rect_dsc.bg_opa = LV_OPA_COVER; /* embeddedt note: changed opacity to COVER to ensure solid background */
        draw_rect_dsc.bg_color = dsc->line_dsc->color;

        lv_area_t a;
        a.x1 = dsc->p1->x;
        a.x2 = dsc->p2->x - 1;
        a.y1 = LV_MIN(dsc->p1->y, dsc->p2->y);
        a.y2 = obj->coords.y2;
        lv_draw_rect(&a, dsc->clip_area, &draw_rect_dsc);

        /*Remove the masks*/
        lv_draw_mask_free_param(&line_mask_param);
        lv_draw_mask_remove_id(line_mask_id);
    }
    /*Hook the division lines too*/
    else if(dsc->part == LV_PART_MAIN) {
        if(dsc->line_dsc == NULL || dsc->p1 == NULL || dsc->p2 == NULL) return;

        /*Vertical line*/
        if(dsc->p1->x == dsc->p2->x) {
            dsc->line_dsc->color  = lv_palette_lighten(LV_PALETTE_GREY, 1);
            if(dsc->id == 3) {
                dsc->line_dsc->width  = 2;
                dsc->line_dsc->dash_gap  = 0;
                dsc->line_dsc->dash_width  = 0;
            }
            else {
                dsc->line_dsc->width = 1;
                dsc->line_dsc->dash_gap  = 6;
                dsc->line_dsc->dash_width  = 6;
            }
        }
        /*Horizontal line*/
        else {
            if(dsc->id == 2) {
                dsc->line_dsc->width  = 2;
                dsc->line_dsc->dash_gap  = 0;
                dsc->line_dsc->dash_width  = 0;
            }
            else {
                dsc->line_dsc->width = 2;
                dsc->line_dsc->dash_gap  = 6;
                dsc->line_dsc->dash_width  = 6;
            }

            if(dsc->id == 1  || dsc->id == 3) {
                dsc->line_dsc->color  = lv_palette_main(LV_PALETTE_GREEN);
            } else {
                dsc->line_dsc->color  = lv_palette_lighten(LV_PALETTE_GREY, 1);
            }
        }
    }
}

static void add_data(lv_timer_t * timer)
{
    LV_UNUSED(timer);
    static uint32_t cnt = 0;
    lv_chart_set_next_value(chart1, ser1, lv_rand(20, 90));

    if(cnt % 4 == 0) lv_chart_set_next_value(chart1, ser2, lv_rand(40, 60));

    cnt++;
}

/**
 * Add a faded area effect to the line chart and make some division lines ticker
 */
void lv_example_chart_2(void)
{
    /*Create a chart1*/
    chart1 = lv_chart_create(lv_scr_act());
    lv_obj_set_size(chart1, 200, 150);
    lv_obj_center(chart1);
    lv_chart_set_type(chart1, LV_CHART_TYPE_LINE);   /*Show lines and points too*/

    lv_chart_set_div_line_count(chart1, 5, 7);

    lv_obj_add_event_cb(chart1, draw_event_cb, LV_EVENT_DRAW_PART_BEGIN, NULL);
    lv_chart_set_update_mode(chart1, LV_CHART_UPDATE_MODE_CIRCULAR);

    /*Add two data series*/
    /* embeddedt note: change the order in which you add the series to change their stacking order */
    ser1 = lv_chart_add_series(chart1, lv_palette_main(LV_PALETTE_RED), LV_CHART_AXIS_PRIMARY_Y);
    ser2 = lv_chart_add_series(chart1, lv_palette_main(LV_PALETTE_BLUE), LV_CHART_AXIS_SECONDARY_Y);

    uint32_t i;
    for(i = 0; i < 10; i++) {
        lv_chart_set_next_value(chart1, ser1, lv_rand(20, 90));
        lv_chart_set_next_value(chart1, ser2, lv_rand(30, 70));
    }
}
Thanks so much for the response.
I am adding series dynamically so I can’t change the order as you say. Is there any other way to do it? I have references to each series object stored.
@kisvegabor Is there a way to swap the order of chart series at runtime, instead of having to add them in a specific order? I’m not aware of any.
I’m going to try creating more series than I need and making the unused ones invisible. Then I can hopefully adjust the order I add data in to have the same effect as drawing them in a different order.
It worked! The current colours are bit disgusting but that’s easy enough to change. It’s a shame I cant alter the transparency of the entire thing as they still draw over each other, but I can work with this 
There is no way to do it now.
@Tom_Hepworth
Glad to hear that you made it work.
Would you be interested in adding this as an example to lvgl? If so feel free to send a PR
Sure! I’ll see if I can fit it in next week
hi
@kisvegabor please help is there any way to draw a line and mention value on x axis where y=0
Hi,
Can you use a draw event similar to this?
No, can you tell me the simplest way to achieve it.
There is no such a built-in feature, so using draw events is the way to go. Or you can simple create some widget on the chart (that is the chart is the parent) and position them to the correct place.
lv_chart_get_point_pos_by_id can be sued the get the position of a point on a series.