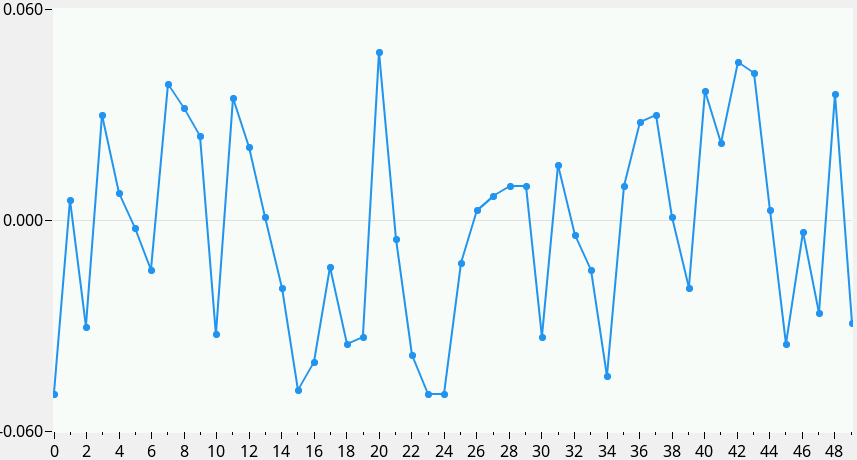
Line graph x axis tick labels

Description

What MCU/Processor/Board and compiler are you using?

Visual Studio

What LVGL version are you using?

9.0.0 “dev” pulled from github today

What do you want to achieve?

Have the X-axis tick labels of a line chart count up by 2, 3, 4, etc… based on how many minor ticks there are.

What have you tried so far?

The set range function for a chart, doesn’t do anything if it’s a line chart. Works fine for a scatter plot though. I’ve modified the source code draw_x_ticks to accomplish what I want, but would rather not have it as a permanent solution ( I have to remember to re-apply the change if I update to a newer version of LVGL).

Code to reproduce

Header.h

/**
 * @file header.h
 *
 */

#ifndef HEADER_H
#define HEADER_H

#ifdef __cplusplus
extern "C" {
#endif

#include "lvgl/lvgl.h"

/*********************
*      INCLUDES
*********************/

/*********************
*      DEFINES
*********************/

// quick call for axis ticks function as most parameters stay the same
#define X_AXIS_TICKS(major, minor)  lv_chart_set_axis_tick(lcd_ui.graph, LV_CHART_AXIS_PRIMARY_X, 7, 3, major, minor, true, 20)

/**********************
*      TYPEDEFS
**********************/
typedef struct {
    lv_obj_t* chart;
    lv_obj_t* dropdown;
}lv_ui;

/**********************
* GLOBAL PROTOTYPES
**********************/
void create_test(lv_ui*);

/**********************
*      MACROS
**********************/
extern lv_ui lcd_ui;

#ifdef __cplusplus
} /* extern "C" */
#endif

#endif /*HEADER_H*/

Source.c

#include "Header.h"
#include <stdlib.h>

lv_coord_t data[1000];
lv_chart_series_t* ser;

lv_style_t chart_base;
lv_style_t chart_div_line_base;

static void update_data_points(lv_event_t* e)
{
    lv_obj_t* obj = lv_event_get_target(e);
    uint16_t data_point_count = 0;
    char dropdown_str[4] = { '\0' };
    lv_dropdown_get_selected_str(obj, dropdown_str, 4);
    data_point_count = (uint16_t)strtod(dropdown_str, NULL);

    lv_chart_set_point_count(lcd_ui.chart, data_point_count);
    //lv_chart_set_range(lcd_ui.chart, LV_CHART_AXIS_PRIMARY_X, 0, data_point_count - 1);

    if (data_point_count <= 25)
    {
        lv_chart_set_axis_tick(lcd_ui.chart, LV_CHART_AXIS_PRIMARY_X, 7, 3, data_point_count, 1, true, 65);
    }
    else
    {
        lv_chart_set_axis_tick(lcd_ui.chart, LV_CHART_AXIS_PRIMARY_X, 7, 3, 25, data_point_count / 25, true, 65);
    }

    lv_chart_refresh(lcd_ui.chart);
}

void create_test(lv_ui* ui)
{
    for (int i = 0; i < 1000; ++i)
    {
        data[i] = (lv_coord_t)(((double)rand() / (double)RAND_MAX) * 200.0 - 100.0);
    }
    ui->chart = lv_chart_create(lv_scr_act());

    lv_style_init(&chart_base);
    lv_style_init(&chart_div_line_base);

    // Style for the base properties of a graph
    lv_style_set_radius(&chart_base, 0);
    lv_style_set_border_width(&chart_base, 1);
    lv_style_set_pad_all(&chart_base, 0);

    // Style for the base properties of the graph division lines
    lv_style_set_text_font(&chart_div_line_base, &lv_font_montserrat_16);

    lv_obj_set_pos(ui->chart, 80, 10);
    lv_obj_set_size(ui->chart, 800, 425);
    lv_chart_set_type(ui->chart, LV_CHART_TYPE_LINE);
    lv_obj_add_style(ui->chart, &chart_base, LV_PART_MAIN | LV_STATE_DEFAULT);
    lv_obj_add_style(ui->chart, &chart_div_line_base, LV_PART_TICKS | LV_STATE_DEFAULT);
    lv_chart_set_div_line_count(ui->chart, 3, 2);
    lv_chart_set_axis_tick(ui->chart, LV_CHART_AXIS_PRIMARY_Y, 7, 3, 3, 2, true, 65);
    lv_chart_set_axis_tick(ui->chart, LV_CHART_AXIS_PRIMARY_X, 7, 3, 10, 1, true, 65);
    lv_chart_set_range(ui->chart, LV_CHART_AXIS_PRIMARY_Y, -100, 100);
    ser = lv_chart_add_series(ui->chart, lv_color_hex(0xff0000), LV_CHART_AXIS_PRIMARY_Y);
    lv_chart_set_point_count(ui->chart, 10);
    lv_chart_set_ext_y_array(ui->chart, ser, (lv_coord_t*)data);

    ui->dropdown = lv_dropdown_create(lv_scr_act());
    lv_obj_set_pos(ui->dropdown, 805, 462);
    lv_obj_set_size(ui->dropdown, 95, 35);
    lv_dropdown_set_symbol(ui->dropdown, LV_SYMBOL_DOWN);
    lv_dropdown_set_options_static(ui->dropdown, "5\n10\n15\n20\n25\n50\n75\n100");
    lv_obj_add_event_cb(ui->dropdown, update_data_points, LV_EVENT_VALUE_CHANGED, NULL);
    lv_event_send(ui->dropdown, LV_EVENT_VALUE_CHANGED, NULL);
}

Screenshot and/or video

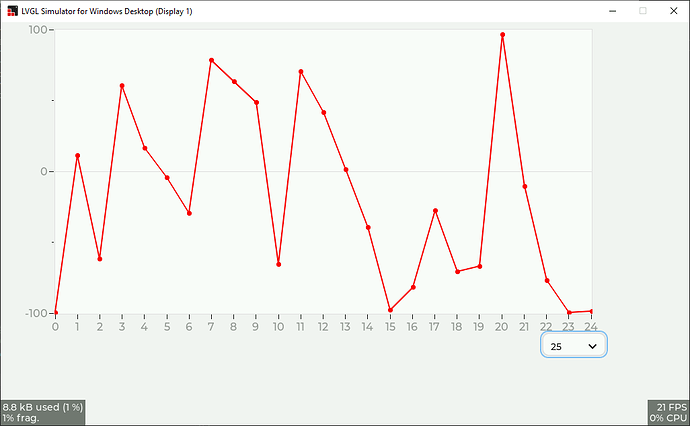
Below shows the user has selected 25 points to display and 25 points (0-24) are displayed correctly.


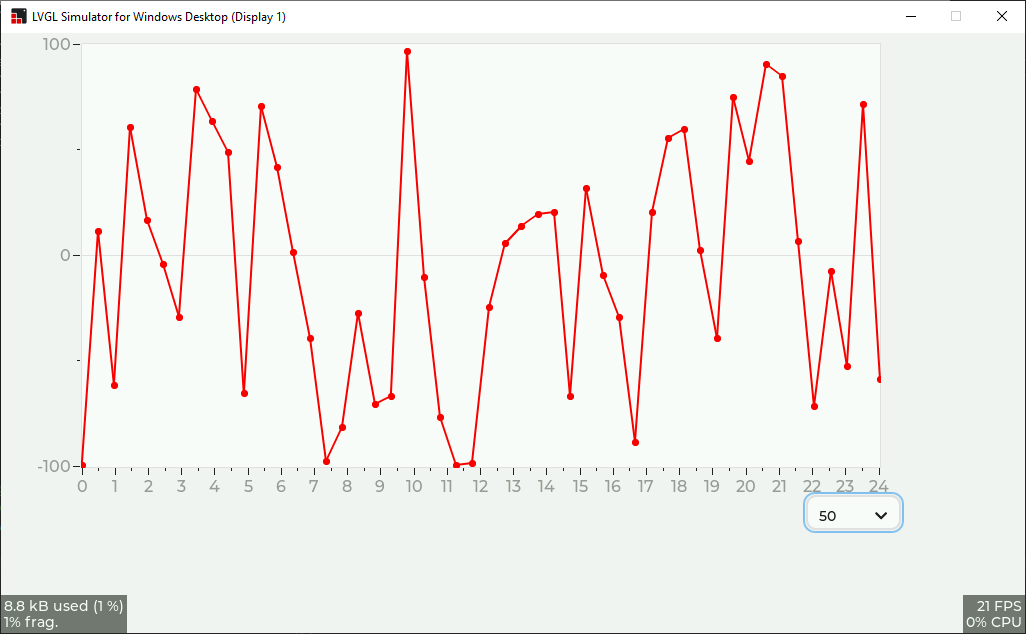
Below shows the user has selected 50 points to display and 50 points are displayed but the x-axis label is still 0-24 instead of 0-49 (0, 2, 4, 6, 8, etc… on each major tick).
Hi @cmoran ,

Take a look at this example in the documentation, you need to create a custom draw event call-back function. This will make your solution possible without having to modify the LVGL source code :slight_smile:

Kind Regards,

Pete

1 Like

Thanks @pete-pjb I must’ve missed that when looking over the examples.

1 Like

So I’ve fixed the x-axis ticks labels to behave the way I want with an event callback, but I’ve noticed something else. For 25 points 0-24 works fine, but for 50 points the 0-24 becomes 0-48 counting by 2s which technically only shows 49 total ticks whereas I need 50. Is there a way to make the line graph ticks end on a minor tick instead of a major? You can see the tick mark and point misalignment if you look at the points and ticks at 11 and 12 on the second image.

Here’s a screenshot of what I want, although it was done through modifying the source code, something I’m trying to avoid.

@pete-pjb Any thoughts?

Hi @cmoran ,

I am sorry I haven’t gotten back to you, but I am really busy right now. Hopefully someone else will give you some feedback here… perhaps if you can post a simple code example which is at the almost required stage which I can paste into the simulator, I might be able to take a quick look at some point soon.

Kind Regards,

Pete

Hi @pete-pjb ,

I took a second to make up an example for the simulator. In the example you can see that when the dropdown for how many points to display is below or at 25 it works perfectly fine. Once you select 50 or more I introduce minor ticks, instead of every tick being a major, this is where the issue begins.

It seems as though LVGL’s chart must start and end on a major tick, so if I want to display say 50 data points then I’d want 25 major ticks and 25 minor ticks. If you set the major tick count to be 25 and minor to be 2 (every other tick is a minor) then you only get 49 total ticks, if you put the major tick count to be 26 and minor to be 2 you get 51 total ticks. I’ve made this togglable with the variable major_ticks in my example so you can change between 25 and 26 to see this.

/*
 * PROJECT:   LVGL PC Simulator using Visual Studio
 * FILE:      LVGL.Simulator.cpp
 * PURPOSE:   Implementation for LVGL ported to Windows Desktop
 *
 * LICENSE:   The MIT License
 *
 * DEVELOPER: Mouri_Naruto (Mouri_Naruto AT Outlook.com)
 */

#include <Windows.h>

#include "resource.h"

#if _MSC_VER >= 1200
 // Disable compilation warnings.
#pragma warning(push)
// nonstandard extension used : bit field types other than int
#pragma warning(disable:4214)
// 'conversion' conversion from 'type1' to 'type2', possible loss of data
#pragma warning(disable:4244)
#endif

#include "lvgl/lvgl.h"
#include "lv_drivers/win32drv/win32drv.h"

#if _MSC_VER >= 1200
// Restore compilation warnings.
#pragma warning(pop)
#endif

#include <stdio.h>
#include <stdlib.h>

static void create_graph(void);

bool single_display_mode_initialization()
{
    if (!lv_win32_init(
        GetModuleHandleW(NULL),
        SW_SHOW,
        1024,
        600,
        LoadIconW(GetModuleHandleW(NULL), MAKEINTRESOURCE(IDI_LVGL))))
    {
        return false;
    }

    lv_win32_add_all_input_devices_to_group(NULL);

    return true;
}

int main()
{
    lv_init();

    if (!single_display_mode_initialization())
    {
        return -1;
    }

    create_graph();

    // ----------------------------------
    // Task handler loop
    // ----------------------------------

    while (!lv_win32_quit_signal)
    {
        lv_task_handler();
        Sleep(1);
    }

    return 0;
}

typedef struct {
    lv_obj_t* chart;
    lv_obj_t* dropdown;
}lv_ui;

lv_ui ui;
lv_coord_t data[100];
lv_chart_series_t* ser;
uint16_t data_point_count = 0;
const lv_coord_t major_ticks = 26;

static void update_data_points(lv_event_t* e)
{
    lv_obj_t* obj = lv_event_get_target(e);
    char dropdown_str[4] = { '\0' };
    lv_dropdown_get_selected_str(obj, dropdown_str, 4);
    data_point_count = (uint16_t)strtod(dropdown_str, NULL);

    lv_chart_set_point_count(ui.chart, data_point_count);

    if (data_point_count <= 25)
    {
        lv_chart_set_axis_tick(ui.chart, LV_CHART_AXIS_PRIMARY_X, 7, 3, data_point_count, 1, true, 65);
    }
    else
    {
        lv_chart_set_axis_tick(ui.chart, LV_CHART_AXIS_PRIMARY_X, 7, 3, major_ticks, data_point_count / 25, true, 65);
    }
}

static void draw_tick_marks_cb(lv_event_t* e)
{
    lv_obj_draw_part_dsc_t* dsc = lv_event_get_draw_part_dsc(e);
    if (!lv_obj_draw_part_check_type(dsc, &lv_chart_class, LV_CHART_DRAW_PART_TICK_LABEL)) return;

    if (dsc->id == LV_CHART_AXIS_PRIMARY_X && dsc->text)
    {
        lv_chart_t* chart = (lv_chart_t*)ui.chart;
        lv_chart_tick_dsc_t* t = &chart->tick[1];

        char month[major_ticks][4] = { {'\0'} };

        for (uint8_t i = 0; i < major_ticks; ++i)
        {
            lv_snprintf(month[i], 4, "%d", t->minor_cnt * i);
        }

        lv_snprintf(dsc->text, dsc->text_length, "%s", month[dsc->value]);
    }
}

static void create_graph(void)
{
    for (uint16_t i = 0; i < 100; ++i)
    {
        data[i] = (lv_coord_t)(((double)rand() / (double)RAND_MAX) * 200.0 - 100.0);
    }

    ui.chart = lv_chart_create(lv_scr_act());
    ui.dropdown = lv_dropdown_create(lv_scr_act());

    // chart styling
    lv_obj_set_style_radius(ui.chart, 0, LV_PART_MAIN | LV_STATE_DEFAULT);
    lv_obj_set_style_border_width(ui.chart, 1, LV_PART_MAIN | LV_STATE_DEFAULT);
    lv_obj_set_style_pad_all(ui.chart, 0, LV_PART_MAIN | LV_STATE_DEFAULT);

    // chart positioning and setup
    lv_obj_set_pos(ui.chart, 80, 10);
    lv_obj_set_size(ui.chart, 800, 425);
    lv_chart_set_type(ui.chart, LV_CHART_TYPE_LINE);
    lv_chart_set_div_line_count(ui.chart, 3, 2);
    lv_chart_set_axis_tick(ui.chart, LV_CHART_AXIS_PRIMARY_Y, 7, 3, 3, 2, true, 65);
    lv_chart_set_axis_tick(ui.chart, LV_CHART_AXIS_PRIMARY_X, 7, 3, 10, 1, true, 65);
    lv_chart_set_range(ui.chart, LV_CHART_AXIS_PRIMARY_Y, -100, 100);
    ser = lv_chart_add_series(ui.chart, lv_color_hex(0xff0000), LV_CHART_AXIS_PRIMARY_Y);
    lv_chart_set_point_count(ui.chart, 10);
    lv_chart_set_ext_y_array(ui.chart, ser, (lv_coord_t*)data);
    lv_obj_add_event_cb(ui.chart, draw_tick_marks_cb, LV_EVENT_DRAW_PART_BEGIN, NULL);

    // dropdown positioning and setup
    lv_obj_set_pos(ui.dropdown, 805, 462);
    lv_obj_set_size(ui.dropdown, 95, 35);
    lv_dropdown_set_symbol(ui.dropdown, LV_SYMBOL_DOWN);
    lv_dropdown_set_options_static(ui.dropdown, "5\n10\n15\n20\n25\n50\n75\n100");
    lv_obj_add_event_cb(ui.dropdown, update_data_points, LV_EVENT_VALUE_CHANGED, NULL);
    lv_event_send(ui.dropdown, LV_EVENT_VALUE_CHANGED, NULL);
}

My solution for editing the source code was to make the variable (in the example) data_point_count external and then add a header to lv_chart.c so it had access to it. From there I changed the lines:
(line 1579 in lv_chart.c) uint32_t total_tick_num = (t->major_cnt - 1) * t->minor_cnt;
to uint32_t total_tick_num = data_point_count - 1;
and
(line 1599 in lv_chart.c) tick_value = i / t->minor_cnt;
to tick_value = i;

The first modification allows the ticks on a chart to end on a minor instead of major. The second modification removes the need for the custom tick label callback as it would still count minor ticks as major.

Hi @pete-pjb ,

For some reason I can’t find your reply here but I received an email version of your reply also. I agree, doing:
uint32_t total_tick_num = chart->point_cnt - 1; works better than my solution as you wouldn’t need to include the header I had with a global variable. I tested it out with my little example and it worked well.

Although I believe you’d only want this behaviour if it were a line graph (each tick on the x-axis represents 1 data point), but say a scatter plot or bar graph most likely wouldn’t want this behaviour. Therefore I propose the modification should be as below:

uint32_t total_tick_num;
if (chart->type == LV_CHART_TYPE_LINE)
{
    total_tick_num = chart->point_cnt - 1;
}
else
{
    total_tick_num = (t->major_cnt - 1) * t->minor_cnt;
}

This way we preserve the current behaviour for all chart types other than the line graph. I’ve yet to make a pull request on Github, but I’ll look into the process.

Hi @cmoran ,

I deleted my previous post as it breaks all sorts if you have charts with large numbers of points and the plotted points are less than the real points as it were… (like my own projects!) I am still looking at this and will come back with a solution shortly, I hope!

Kind Regards,

Pete

Hi @cmoran ,

Thanks for posting the example.

I think we have a working solution now :slight_smile:. I also agree with your test for LV_CHART_TYPE_LINE so putting things together I would suggest a change in lv_chart.c as follows:

replace:

with:

    uint32_t total_tick_num;
    if (chart->type == LV_CHART_TYPE_LINE && (((t->major_cnt - 1) * t->minor_cnt) == chart->point_cnt))
    {
        total_tick_num = chart->point_cnt - 1;
    }
    else
    {
        total_tick_num = (t->major_cnt - 1) * t->minor_cnt;
    }

This allows for those like my self who have more points than can be displayed.

If you are happy with this can you submit a pull request here please and I am sure @kisvegabor will get it merged to all the relevant places as he may want to back issue the change or he may have other ideas also…

Kind Regards,

Pete

Hi @pete-pjb ,

I got the chance to play around with the code, I tried it out with some more complex use cases. The example I made for the simulator doesn’t entirely reflect my own code as I wanted to keep it simple.

That said it appears to be behaving the way I want it to after modifying the tick marks callback function to include cases such as, I only want to display 50 points on the chart but have more than 50 points of data total, so only display the most recent 50 points.

One thing I did run into (it only happened once) was, I selected a different option on my dropdown I believe at the same time LVGL tried to draw the tick marks and somehow total_tick_num ending up being 0. Of course this caused a divide by zero exception, so I believe below the if else there should be a sanity check that total_tick_num is not equal to zero, such as:

...
    uint32_t total_tick_num;
    if (chart->type == LV_CHART_TYPE_LINE && (((t->major_cnt - 1) * t->minor_cnt) == chart->point_cnt))
    {
        total_tick_num = chart->point_cnt - 1;
    }
    else
    {
        total_tick_num = (t->major_cnt - 1) * t->minor_cnt;
    }
    if (!total_tick_num) return; // Ensure total_tick_num is not equal to 0
...
1 Like

Hi @cmoran ,

Sounds good, not sure what could have happened to get a 0 in there but it never hurts to check for and prevent a divide by zero.

So are you happy to submit a pull request or would you like me to do it? :smiley:

Kind Regards,

Pete

1 Like

Hi @pete-pjb ,

I’ll give the pull request a shot, just have to read over the contributing section in the documentation to be sure I format things properly.

@cmoran ,

That’s great thank you, if you have any problems drop a message this thread. :blush:

Cheers,

Pete

@pete-pjb ,

I’m unsure if I did that 100% right but the pull request can be found here.

1 Like

Hi @cmoran ,

Yes you did it right, but there is a formatting issue. You should be able to just re-edit your fork and push your changes and it should update the pull-request, this saves doing it all over again :smiley:

I hope that makes sense.

Kind Regards,

Pete

Hi @cmoran ,

I see you worked that out for yourself :+1:

Cheers,

Pete

@pete-pjb ,

Yes I managed to figure that out, although I forgot to re-edit the commit message for the format edit, I hope that’s not an issue.

No worries @cmoran , I am sure it will be fine… I have put a note on for @kisvegabor to review and back port if he feels it is necessary…

Thanks again.

Cheers,

Pete

1 Like