Description
I have noticed that the last major tickline isn’t drawn on any of the axis’. Is this a bug?
What MCU/Processor/Board and compiler are you using?
Simulator
What LVGL version are you using?
The newest. Just downloaded it to make sure it wasn’t already fixed
What do you want to achieve?
I would like to have the last tick lines drawn on my axis’
What have you tried so far?
I have messed a bit around in lv_chart.c but it hasnt changed anything.
Code to reproduce
I don’t think its a problem with my code but… you never know of course.
I hope I included all the necessary parts. This is quickly put together from the “actual code”
/*You code here*/
char yValueList[100] = {""};
char xValueList[100] = {""};
char yValue[10]      = {""};
char xValue[10]      = {""};

lv_chart_ext_t * chart_ext;
lv_chart_axis_cfg_t * x_axis_ext;
lv_chart_axis_cfg_t * y_axis_ext;

static lv_obj_t* chart              = NULL;


void func(void) {
chart = lv_chart_create(lv_scr_act(), NULL);
//lv_obj_add_style                    (chart, LV_CHART_PART_BG, &style_win_bg);
lv_obj_set_style_local_size         (chart, LV_CHART_PART_SERIES, LV_STATE_DEFAULT, 1);
lv_obj_set_style_local_line_width   (chart, LV_CHART_PART_SERIES, LV_STATE_DEFAULT, 0);
lv_obj_set_size                     (chart, 220, 240);
lv_obj_align                        (chart, Container, LV_ALIGN_CENTER, 0, 0);
lv_chart_set_type                   (chart, LV_CHART_TYPE_LINE);   //Show lines and points too
lv_chart_set_update_mode            (chart, LV_CHART_UPDATE_MODE_SHIFT);
lv_chart_set_point_count            (chart, POINTCOUNT);
lv_chart_set_range                  (chart, -30, 40);
lv_obj_set_event_cb                 (chart, Scrollable_cb);
//lv_chart_cursor_t *c1 = lv_chart_add_cursor(chart, LV_COLOR_RED, LV_CHART_CURSOR_LEFT);
lv_obj_set_style_local_pad_top      (chart, LV_OBJ_PART_MAIN, LV_STATE_DEFAULT, 10);
lv_obj_set_style_local_pad_bottom   (chart, LV_OBJ_PART_MAIN, LV_STATE_DEFAULT, 30);
lv_obj_set_style_local_pad_left     (chart, LV_OBJ_PART_MAIN, LV_STATE_DEFAULT, 50);
lv_obj_set_style_local_pad_right    (chart, LV_OBJ_PART_MAIN, LV_STATE_DEFAULT, 25);
lv_obj_set_style_local_text_font    (chart, LV_OBJ_PART_MAIN, LV_STATE_DEFAULT, &lv_font_unscii_8);

AxisPlotter(chart, XminData /*this is just integers*/, XmaxData /*this is just integers*/![image|237x317], 3, 4, chart_ext->ymax[LV_CHART_AXIS_PRIMARY_Y], chart_ext->ymin[LV_CHART_AXIS_PRIMARY_Y], (int) (chart_ext->ymax[LV_CHART_AXIS_PRIMARY_Y]-chart_ext->ymin[LV_CHART_AXIS_PRIMARY_Y])/10, 3, 3, 2);
}

void AxisPlotter(lv_obj_t * chart, int xMin, int xMax, int xTickLength, int xMinorLine, int yMin, int yMax, int yTickLength, int yMinorLine, int hDiv, int vDiv) {
    if (chart == NULL) return;
    y_axis_ext = &chart_ext->y_axis;
    x_axis_ext = &chart_ext->x_axis;
    y_axis_ext->options = LV_CHART_AXIS_DRAW_LAST_TICK;
    x_axis_ext->options = LV_CHART_AXIS_INVERSE_LABELS_ORDER;

    lv_chart_refresh(chart);

    strcpy(yValueList,"");
    strcpy(xValueList,"");
    strcpy(yValue,"");
    strcpy(xValue,"");
    for (int y = 0; y <= yTickLength; y++) {
        sprintf(yValue, "%i", (int)(((yMax - yMin) * y / yTickLength) + yMin));
        strcat(yValueList, yValue);
        if (y < yTickLength) {
            strcat(yValueList, "\n");
        }
    }
    for (int x = 0; x <= xTickLength; x++) {
        sprintf(xValue, "%i", (int)(((xMax - xMin) * x / xTickLength) + xMin));
        strcat(xValueList, xValue);
        if (x < xTickLength) {
            strcat(xValueList, "\n");
        }
    }

    //strcat(xValueList, "0");
    //strcat(yValueList, "0");


    lv_chart_set_y_tick_length(chart, 4, 3);
    lv_chart_set_y_tick_texts(chart, yValueList, yMinorLine, NULL);
    lv_chart_set_div_line_count(chart,hDiv,vDiv);
    lv_chart_set_x_tick_texts(chart, xValueList, xMinorLine, NULL);
    lv_chart_set_x_tick_length(chart, 4, 3);
Screenshot and/or video
If possible, add screenshots and/or videos about the current state.
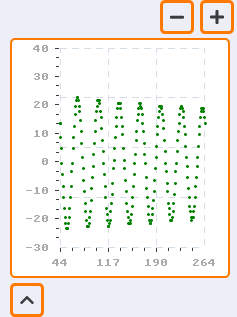
As visible on the end of the X-axis there is missing a tick mark, and likewise at the start of the y axis
Is this intentional or is it my mistake and is there any fix?