

Hello,
I am developing a project using LVGL to display an auditory frequency chart ranging from 5000 Hz down to 1000 Hz. Each point on the chart displays decibel values above it. The chart needs to update these decibel values in real-time, with new values appearing above the corresponding points.
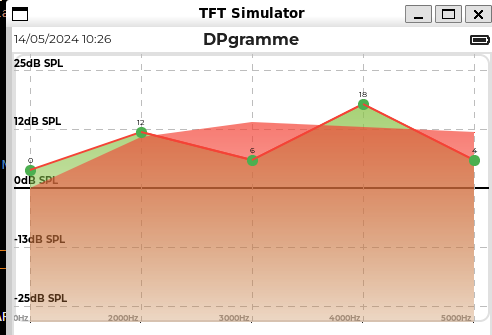
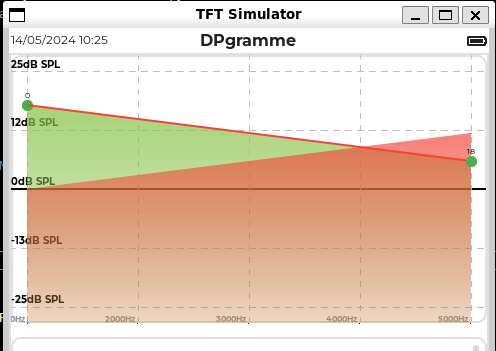
Encountered Issue: The text labels above the chart points are not updating correctly. Although the points themselves update in the correct order (from 5000 Hz down to 1000 Hz), the text (decibel value label) above the last point (on the right) does not refresh properly and continues to display the value from the first point (on the left) once the plotting is complete.
Problem Description:
- Expected Behavior: Each new data point should appear with its corresponding value label above it, starting from 5000 Hz decreasing to 1000 Hz sequentially. Once plotted, a point’s label should remain static.
- Current Issue: The label for the 5000 Hz point continuously updates in real time, reflecting new measurement values that should be assigned to subsequent points (4000 Hz, 3000 Hz, etc.). By the time the measurement sequence is completed, the initial point (5000 Hz) ends up displaying the value intended for the last point (1000 Hz).
Example of the Behavior:
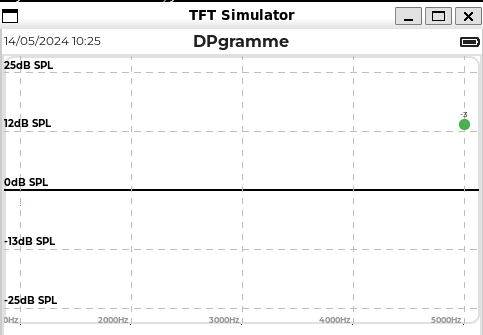
- The point at 5000 Hz is drawn with an initial value.
- As the chart updates to 4000 Hz, the new value displays correctly above 4000 Hz, but as the plot reaches 1000 Hz, the value at 5000 Hz resets to that of 1000 Hz.
Question: How can I ensure that each text label updates correctly above its respective point when the decibel values are modified in real-time? Is there a better approach to handle the updating of labels in an LVGL chart using drawing events or specific properties?
Example:
- When plotting begins at 5000 Hz, the point appears correctly.
- As the plot updates to 4000 Hz, the label at 5000 Hz updates to the new current value, and this behavior continues down to 1000 Hz.
- Ultimately, all points refresh their labels to new values intended for subsequent measurements, which disrupts the readability and accuracy of the data display.
I have attempted various fixes and adjustments in my code, but the problem persists, suggesting that I might be missing something fundamental about how LVGL handles these dynamic updates. Any guidance or insights would be greatly appreciated.
Here is a code snippet illustrating how labels are drawn in the drawing event:
void cGraphDPgramme::draw_event_cb(lv_event_t *e)
{
lv_obj_t *obj = lv_event_get_target(e);
cGraphDPgramme *graphObjPtr = (cGraphDPgramme *)lv_event_get_user_data(e);
// cGraphDPgramme graphObjPtr = static_cast<cGraphDPgramme>(lv_event_get_user_data(e));
lv_obj_draw_part_dsc_t *dsc = lv_event_get_draw_part_dsc(e);
// cGraphDPgramme *graphObjPtr = reinterpret_cast<cGraphDPgramme *>(lv_event_get_user_data(e));
// lv_obj_draw_part_dsc_t *dsc = lv_event_get_draw_part_dsc(e);
static lv_coord_t lastPoint_x;
static lv_coord_t lastPoint_y;
if (e->code == LV_EVENT_DRAW_PART_END)
{
int32_t id = lv_chart_get_pressed_point(obj);
if (dsc->part == LV_PART_ITEMS)
{
/Affichage de type area pour les serie Signal et Noise/
if ((dsc->sub_part_ptr == graphObjPtr->serSignal) || (dsc->sub_part_ptr == graphObjPtr->serNoise))
{
if (!dsc->p1 || !dsc->p2)
return;
/Add a line mask that keeps the area below the line/
lv_draw_mask_line_param_t line_mask_param;
lv_draw_mask_line_points_init(&line_mask_param, dsc->p1->x, dsc->p1->y, dsc->p2->x, dsc->p2->y,
LV_DRAW_MASK_LINE_SIDE_BOTTOM);
int16_t line_mask_id = lv_draw_mask_add(&line_mask_param, NULL);/*Add a fade effect: transparent bottom covering top*/ lv_coord_t h = lv_obj_get_height(obj); lv_draw_mask_fade_param_t fade_mask_param; lv_draw_mask_fade_init(&fade_mask_param, &obj->coords, LV_OPA_COVER, obj->coords.y1 + h / 8, LV_OPA_20, obj->coords.y2); int16_t fade_mask_id = lv_draw_mask_add(&fade_mask_param, NULL); /*Draw a rectangle that will be affected by the mask*/ lv_draw_rect_dsc_t draw_rect_dsc; lv_draw_rect_dsc_init(&draw_rect_dsc); draw_rect_dsc.bg_opa = LV_OPA_80; draw_rect_dsc.bg_color = dsc->line_dsc->color; lv_area_t a; a.x1 = dsc->p1->x; a.x2 = dsc->p2->x - 1; a.y1 = LV_MIN(dsc->p1->y, dsc->p2->y); a.y2 = obj->coords.y2; lv_draw_rect(dsc->draw_ctx, &draw_rect_dsc, &a); /*Remove the masks*/ lv_draw_mask_free_param(&line_mask_param); lv_draw_mask_free_param(&fade_mask_param); lv_draw_mask_remove_id(line_mask_id); lv_draw_mask_remove_id(fade_mask_id); } else if ((dsc->sub_part_ptr == graphObjPtr->serFreq)) { lv_color_t currentColor; if ((int)graphObjPtr->myProcessor->getDPLevel(dsc->id) >= -6) { currentColor = lv_palette_main(LV_PALETTE_GREEN); } else { currentColor = lv_palette_main(LV_PALETTE_RED); } lv_coord_t point_w = 5; lv_coord_t point_h = 5; lv_area_t point_area; dsc->rect_dsc->bg_color = currentColor; char buf[16]; lv_point_t txt_size; lv_snprintf(buf, sizeof(buf), "%d", (int)graphObjPtr->myProcessor->getDPLevel(dsc->id)); lv_txt_get_size(&txt_size, buf, font_default_12, 0, 0, LV_COORD_MAX, LV_TEXT_FLAG_NONE); // char buf[32]; // sprintf(buf, "%d dB SPL", static_cast<int>(graphObjPtr->myProcessor->getDPLevel(dsc->id))); // lv_point_t txt_size; // lv_txt_get_size(&txt_size, buf, font_default_12_b, 0, 0, LV_COORD_MAX, LV_TEXT_FLAG_NONE); lv_draw_label_dsc_t draw_label_dsc; lv_draw_label_dsc_init(&draw_label_dsc); draw_label_dsc.color = lv_color_black(); draw_label_dsc.font = font_default_12; // lv_obj_set_style_text_font(obj, font_default_16, 0); int last_index = lv_chart_get_point_count(obj) -1; std::cout << "Yaaaaaaaaaaaaaaaaaa ==> " << last_index << std::endl; if (dsc->id != last_index) { lv_area_t area_value; if (dsc->p1 && dsc->p2) { /*Affichage des points*/ point_area.x1 = dsc->p1->x - point_w; point_area.x2 = dsc->p1->x + point_w; point_area.y1 = dsc->p1->y - point_h; point_area.y2 = dsc->p1->y + point_h; area_value.x1 = dsc->p1->x - txt_size.x / 2; area_value.x2 = dsc->p1->x + txt_size.x / 2; area_value.y1 = dsc->p1->y - (point_h + txt_size.y); area_value.y2 = dsc->p1->y - point_h; // lv_draw_rect(dsc->draw_ctx, &draw_rect_value, &area_value); lv_draw_label(dsc->draw_ctx, &draw_label_dsc, &area_value, buf, NULL); // print_debug(DEBUG_INFO,"cGraphDPgramme::draw_event_cb lastPoint_x = %ld obj->coords.y2 = %d", lastPoint_x , *dsc->draw_ctx); lv_draw_rect(dsc->draw_ctx, dsc->rect_dsc, &point_area); /*On fait un backup de p2 pour pouvoir afficher le dernier point*/ lastPoint_x = dsc->p2->x; lastPoint_y = dsc->p2->y; /*Affichage des lignes*/ dsc->line_dsc->width = 2; dsc->line_dsc->color = lv_palette_main(LV_PALETTE_RED); lv_draw_line(dsc->draw_ctx, dsc->line_dsc, dsc->p1, dsc->p2); } else if (!dsc->p1 && !dsc->p2) { /*la librairie met p1 et p2 a null lors de l'affichage du dernier point du coup on se base sur le backup de p2 fait lors de la passe precedents*/ point_area.x1 = lastPoint_x - point_w; point_area.x2 = lastPoint_x + point_w; point_area.y1 = lastPoint_y - point_h; point_area.y2 = lastPoint_y + point_h; area_value.x1 = lastPoint_x - txt_size.x / 2; area_value.x2 = lastPoint_x + txt_size.x / 2; area_value.y1 = lastPoint_y - (point_h + txt_size.y); area_value.y2 = lastPoint_y - point_h; lv_draw_label(dsc->draw_ctx, &draw_label_dsc, &area_value, buf, NULL); lv_draw_rect(dsc->draw_ctx, dsc->rect_dsc, &point_area); } } else { // Logique spécifique pour le dernier point lv_coord_t point_w = 5; lv_coord_t point_h = 5; lv_area_t point_area; point_area.x1 = lastPoint_x - point_w; point_area.x2 = lastPoint_x + point_w; point_area.y1 = lastPoint_y - point_h; point_area.y2 = lastPoint_y + point_h; char buf[16]; lv_snprintf(buf, sizeof(buf), "%d", (int)graphObjPtr->myProcessor->getDPLevel(dsc->id)); lv_point_t txt_size; lv_txt_get_size(&txt_size, buf, font_default_12, 0, 0, LV_COORD_MAX, LV_TEXT_FLAG_NONE); print_debug(DEBUG_INFO,"cGraphDPgramme::draw_event_cb id = %d last_index = %d dsc->id = %ld obj->coords.y2 = %d", lastPoint_x, last_index ,dsc->id, (int)graphObjPtr->myProcessor->getDPLevel(dsc->id)); lv_area_t area_value; area_value.x1 = lastPoint_x - txt_size.x / 2; area_value.x2 = lastPoint_x + txt_size.x / 2; area_value.y1 = lastPoint_y - (point_h + txt_size.y); area_value.y2 = lastPoint_y - point_h; lv_draw_label(dsc->draw_ctx, &draw_label_dsc, &area_value, buf, NULL); lv_draw_rect(dsc->draw_ctx, dsc->rect_dsc, &point_area); } } } else if (dsc->part == LV_PART_TICKS) { if (dsc->id == LV_CHART_AXIS_PRIMARY_Y || dsc->id == LV_CHART_AXIS_PRIMARY_X) { char buf[16]; lv_coord_t label_gap = lv_obj_get_style_pad_left(obj, LV_PART_TICKS); lv_draw_label_dsc_t draw_label_dsc; lv_draw_label_dsc_init(&draw_label_dsc); if (dsc->id == LV_CHART_AXIS_PRIMARY_Y) { draw_label_dsc.font = font_default_14_b; lv_snprintf(buf, sizeof(buf), "%ddB SPL", dsc->value); draw_label_dsc.color = lv_color_black(); } else { draw_label_dsc.font = font_default_12_b; lv_snprintf(buf, sizeof(buf), "%dHz", dsc->value); draw_label_dsc.color = lv_color_lighten(lv_color_black(), 150); } /*reserve appropriate area*/ lv_point_t size; lv_txt_get_size(&size, buf, draw_label_dsc.font, 0, 0, LV_COORD_MAX, LV_TEXT_FLAG_NONE); /*set the area at some distance of the major tick len left of the tick*/ lv_area_t a; a.y1 = dsc->p2->y - size.y; a.y2 = dsc->p2->y; if (dsc->id == LV_CHART_AXIS_PRIMARY_Y) { a.x1 = dsc->p2->x + label_gap; a.x2 = dsc->p2->x + label_gap + size.x; } else { a.x1 = dsc->p2->x - (size.x + label_gap); a.x2 = dsc->p2->x - label_gap; } if (a.y2 >= obj->coords.y1 && a.y1 <= obj->coords.y2) { lv_draw_label(dsc->draw_ctx, &draw_label_dsc, &a, buf, NULL); } } } } if (e->code == LV_EVENT_DRAW_PART_BEGIN) { /*Hook the division lines too*/ if (dsc->part == LV_PART_MAIN) { if (dsc->line_dsc == NULL || dsc->p1 == NULL || dsc->p2 == NULL) return; /*Vertical line*/ if (dsc->p1->x == dsc->p2->x) { } /*Horizontal line*/ else { if (dsc->id == 2) // ligne 0 { dsc->line_dsc->width = 2; dsc->line_dsc->color = lv_color_black(); dsc->line_dsc->dash_gap = 0; dsc->line_dsc->dash_width = 0; } /*else if (dsc->id == 0 || dsc->id == 4){//ligne +180 - 180 dsc->line_dsc->width = 1; dsc->line_dsc->color = lv_color_black(); }*/ else { dsc->line_dsc->width = 1; dsc->line_dsc->color = lv_palette_lighten(LV_PALETTE_GREY, 1); dsc->line_dsc->dash_gap = 6; dsc->line_dsc->dash_width = 6; } } } }}