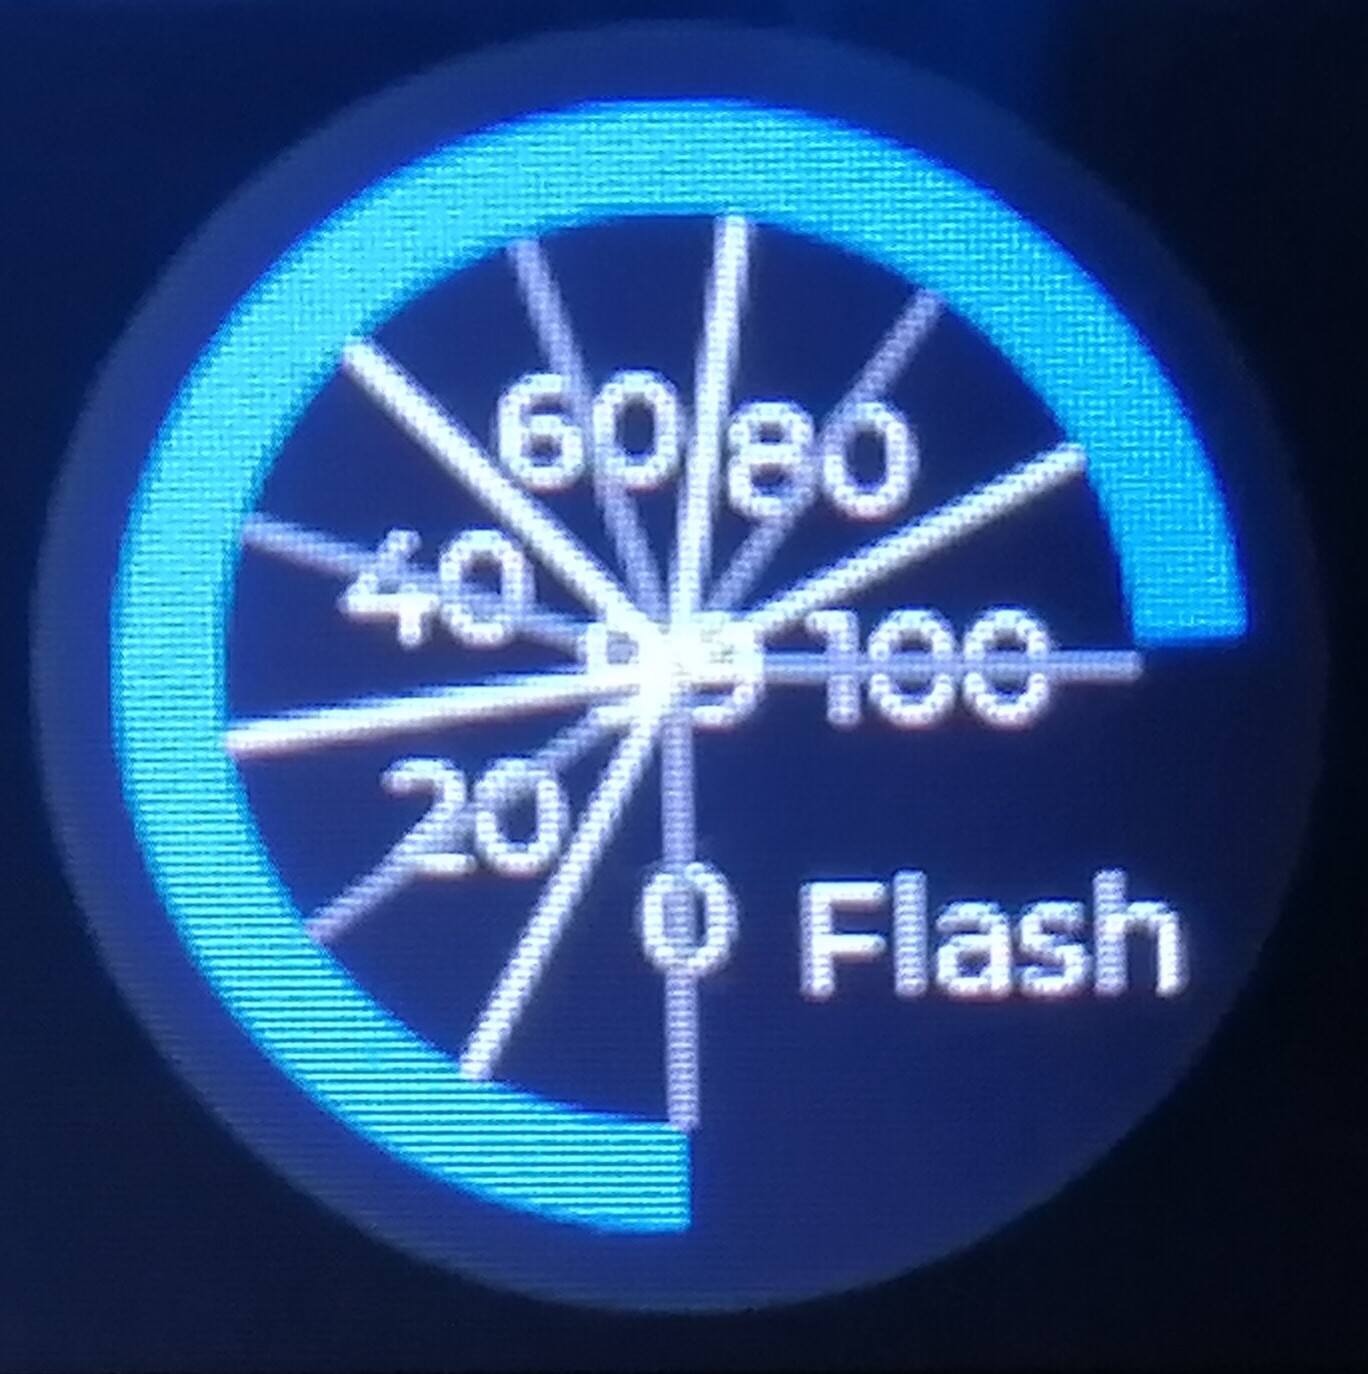
I modified the lv_demo_widget.c in the simulator, to get the effect I’m actually looking for.
When I do this, I get the following meter look:
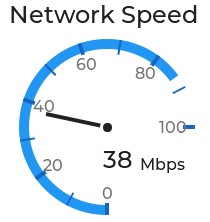
Before my modification the meter in the example looked as follows:
Here is the example code modified, with the original just commented out.
I just added bg_col, to get the background color for the default theme on the ESP32 build, otherwise same as example.
meter3 = create_meter_box(parent, "Network Speed", "Low speed", "Normal Speed", "High Speed");
    if(disp_size < DISP_LARGE) lv_obj_add_flag(lv_obj_get_parent(meter3), LV_OBJ_FLAG_FLEX_IN_NEW_TRACK);

    /*Add a special circle to the needle's pivot*/
    lv_obj_set_style_pad_hor(meter3, 10, 0);
    lv_obj_set_style_size(meter3, 10, LV_PART_INDICATOR);
    lv_obj_set_style_radius(meter3, LV_RADIUS_CIRCLE, LV_PART_INDICATOR);
    lv_obj_set_style_bg_opa(meter3, LV_OPA_COVER, LV_PART_INDICATOR);
    lv_obj_set_style_bg_color(meter3, lv_palette_darken(LV_PALETTE_GREY, 4), LV_PART_INDICATOR);
    lv_obj_set_style_outline_color(meter3, lv_color_white(), LV_PART_INDICATOR);
    lv_obj_set_style_outline_width(meter3, 3, LV_PART_INDICATOR);
    lv_obj_set_style_text_color(meter3, lv_palette_darken(LV_PALETTE_GREY, 1), LV_PART_TICKS);

    /*scale = lv_meter_add_scale(meter3);
    lv_meter_set_scale_range(meter3, scale, 10, 60, 220, 360 - 220);
    lv_meter_set_scale_ticks(meter3, scale, 21, 3, 17, lv_color_white());
    lv_meter_set_scale_major_ticks(meter3, scale, 4, 4, 22, lv_color_white(), 15);*/

   /* added to get the background color of the default theme on my ESP32.*/
    lv_color_t bg_col = lv_obj_get_style_bg_color(parent, 0);

    /*Add a scale first*/
    scale = lv_meter_add_scale(meter3);
    lv_meter_set_scale_range(meter3, scale, 0, 100, 270, 90);  //AJW ie 360-270 = 90
    lv_meter_set_scale_ticks(meter3, scale, 11, 2, 15, bg_col); //lv_color_white()
    lv_meter_set_scale_major_ticks(meter3, scale, 2, 4, 12, bg_col, 10);  //lv_color_white()

    /*indic = lv_meter_add_arc(meter3, scale, 10, lv_palette_main(LV_PALETTE_RED), 0);
    lv_meter_set_indicator_start_value(meter3, indic, 0);
    lv_meter_set_indicator_end_value(meter3, indic, 20);

    indic = lv_meter_add_scale_lines(meter3, scale, lv_palette_darken(LV_PALETTE_RED, 3), lv_palette_darken(LV_PALETTE_RED, 3), true, 0);
    lv_meter_set_indicator_start_value(meter3, indic, 0);
    lv_meter_set_indicator_end_value(meter3, indic, 20);

    indic = lv_meter_add_arc(meter3, scale, 12, lv_palette_main(LV_PALETTE_BLUE), 0);
    lv_meter_set_indicator_start_value(meter3, indic, 20);
    lv_meter_set_indicator_end_value(meter3, indic, 40);

    indic = lv_meter_add_scale_lines(meter3, scale, lv_palette_darken(LV_PALETTE_BLUE, 3), lv_palette_darken(LV_PALETTE_BLUE, 3), true, 0);
    lv_meter_set_indicator_start_value(meter3, indic, 20);
    lv_meter_set_indicator_end_value(meter3, indic, 40);

    indic = lv_meter_add_arc(meter3, scale, 10, lv_palette_main(LV_PALETTE_GREEN), 0);
    lv_meter_set_indicator_start_value(meter3, indic, 40);
    lv_meter_set_indicator_end_value(meter3, indic, 60);

    indic = lv_meter_add_scale_lines(meter3, scale, lv_palette_darken(LV_PALETTE_GREEN, 3), lv_palette_darken(LV_PALETTE_GREEN, 3), true, 0);
    lv_meter_set_indicator_start_value(meter3, indic, 40);
    lv_meter_set_indicator_end_value(meter3, indic, 60); */

    /*Add an arc indicator*/
    indic = lv_meter_add_arc(meter3, scale, 10, lv_palette_main(LV_PALETTE_BLUE), 0);
    lv_meter_set_indicator_start_value(meter3, indic, 0); /*Set the begin value*/
    lv_meter_set_indicator_end_value(meter3, indic, 87); /*Set the current value*/

    indic = lv_meter_add_scale_lines(meter3, scale, lv_palette_darken(LV_PALETTE_BLUE, 3), lv_palette_darken(LV_PALETTE_BLUE, 3), true, 0);
    lv_meter_set_indicator_start_value(meter3, indic, 0); /*Set the begin value*/
    lv_meter_set_indicator_end_value(meter3, indic, 100); /*Set the current value*/
    indic = lv_meter_add_needle_line(meter3, scale, 4, lv_palette_darken(LV_PALETTE_GREY, 4), -25);

    lv_obj_t * mbps_label = lv_label_create(meter3);
    lv_label_set_text(mbps_label, "-");
    lv_obj_add_style(mbps_label, &style_title, 0);

    lv_obj_t * mbps_unit_label = lv_label_create(meter3);
    lv_label_set_text(mbps_unit_label, "Mbps");
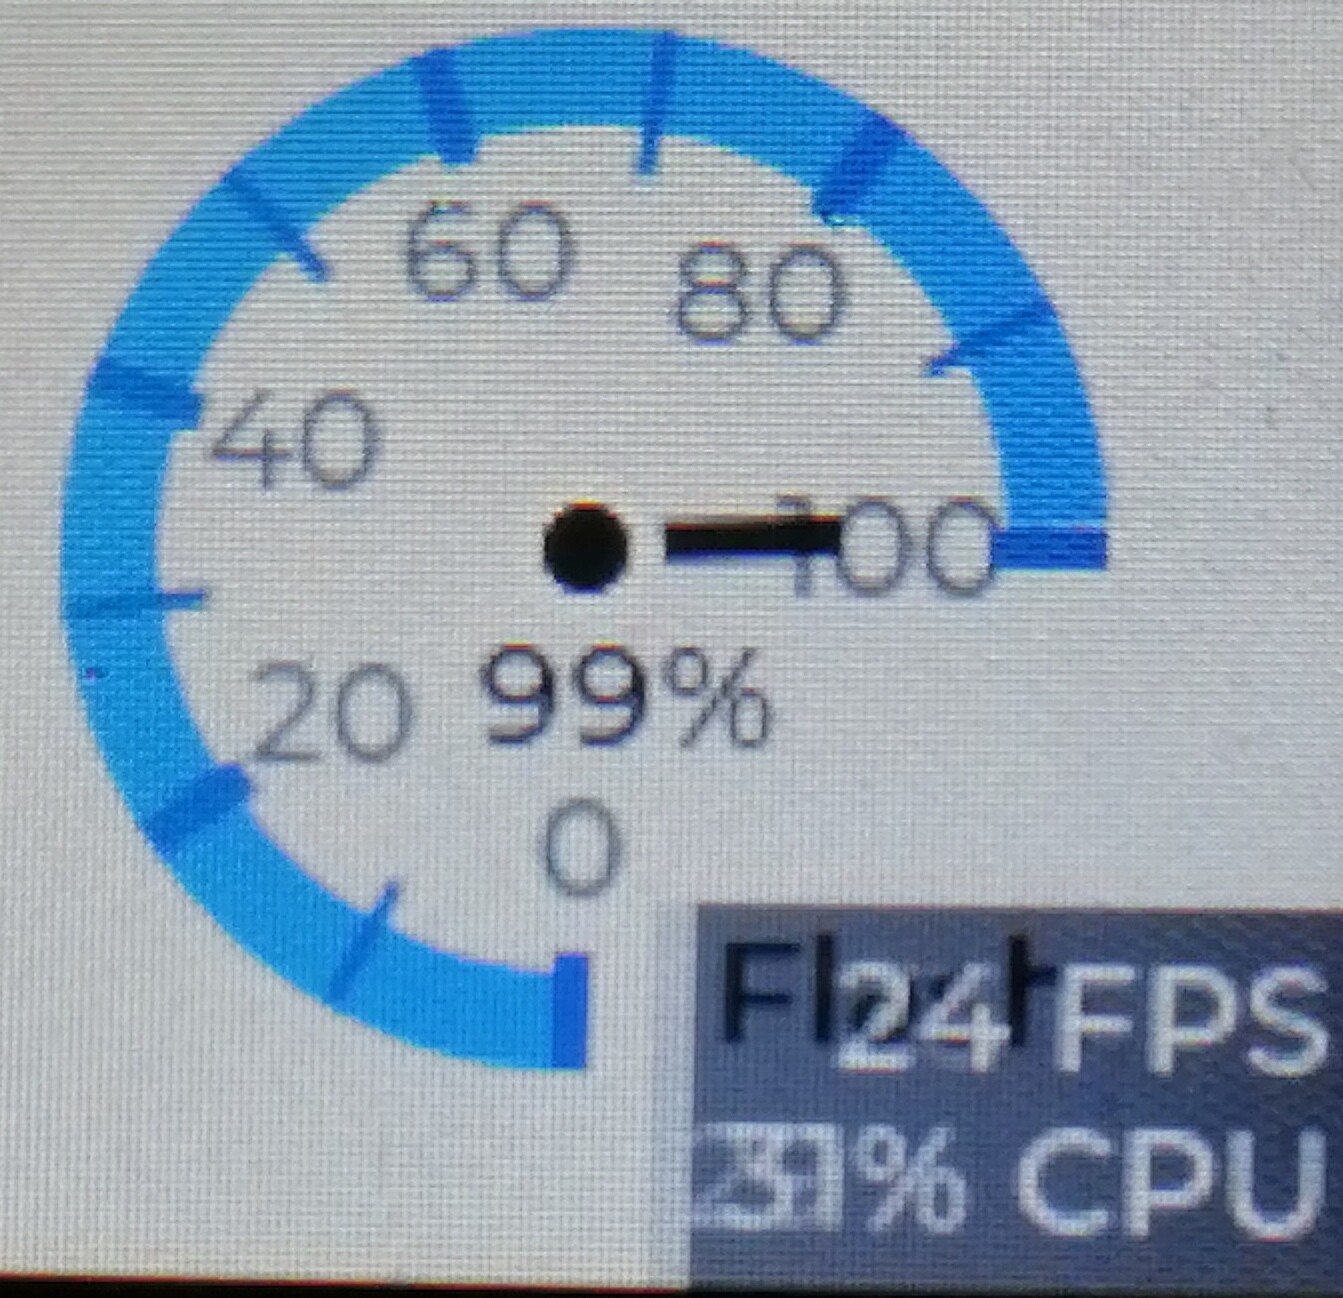
The same code on my device in light theme, looks as follows:
This is very frustrating. I cannot get those lines to disappear, and also note that the dark blue ticks on the arc, that show up in the simulator, do not show up on the device.
Thus I can only conclude that the device is not behaving similarly to the simulator.