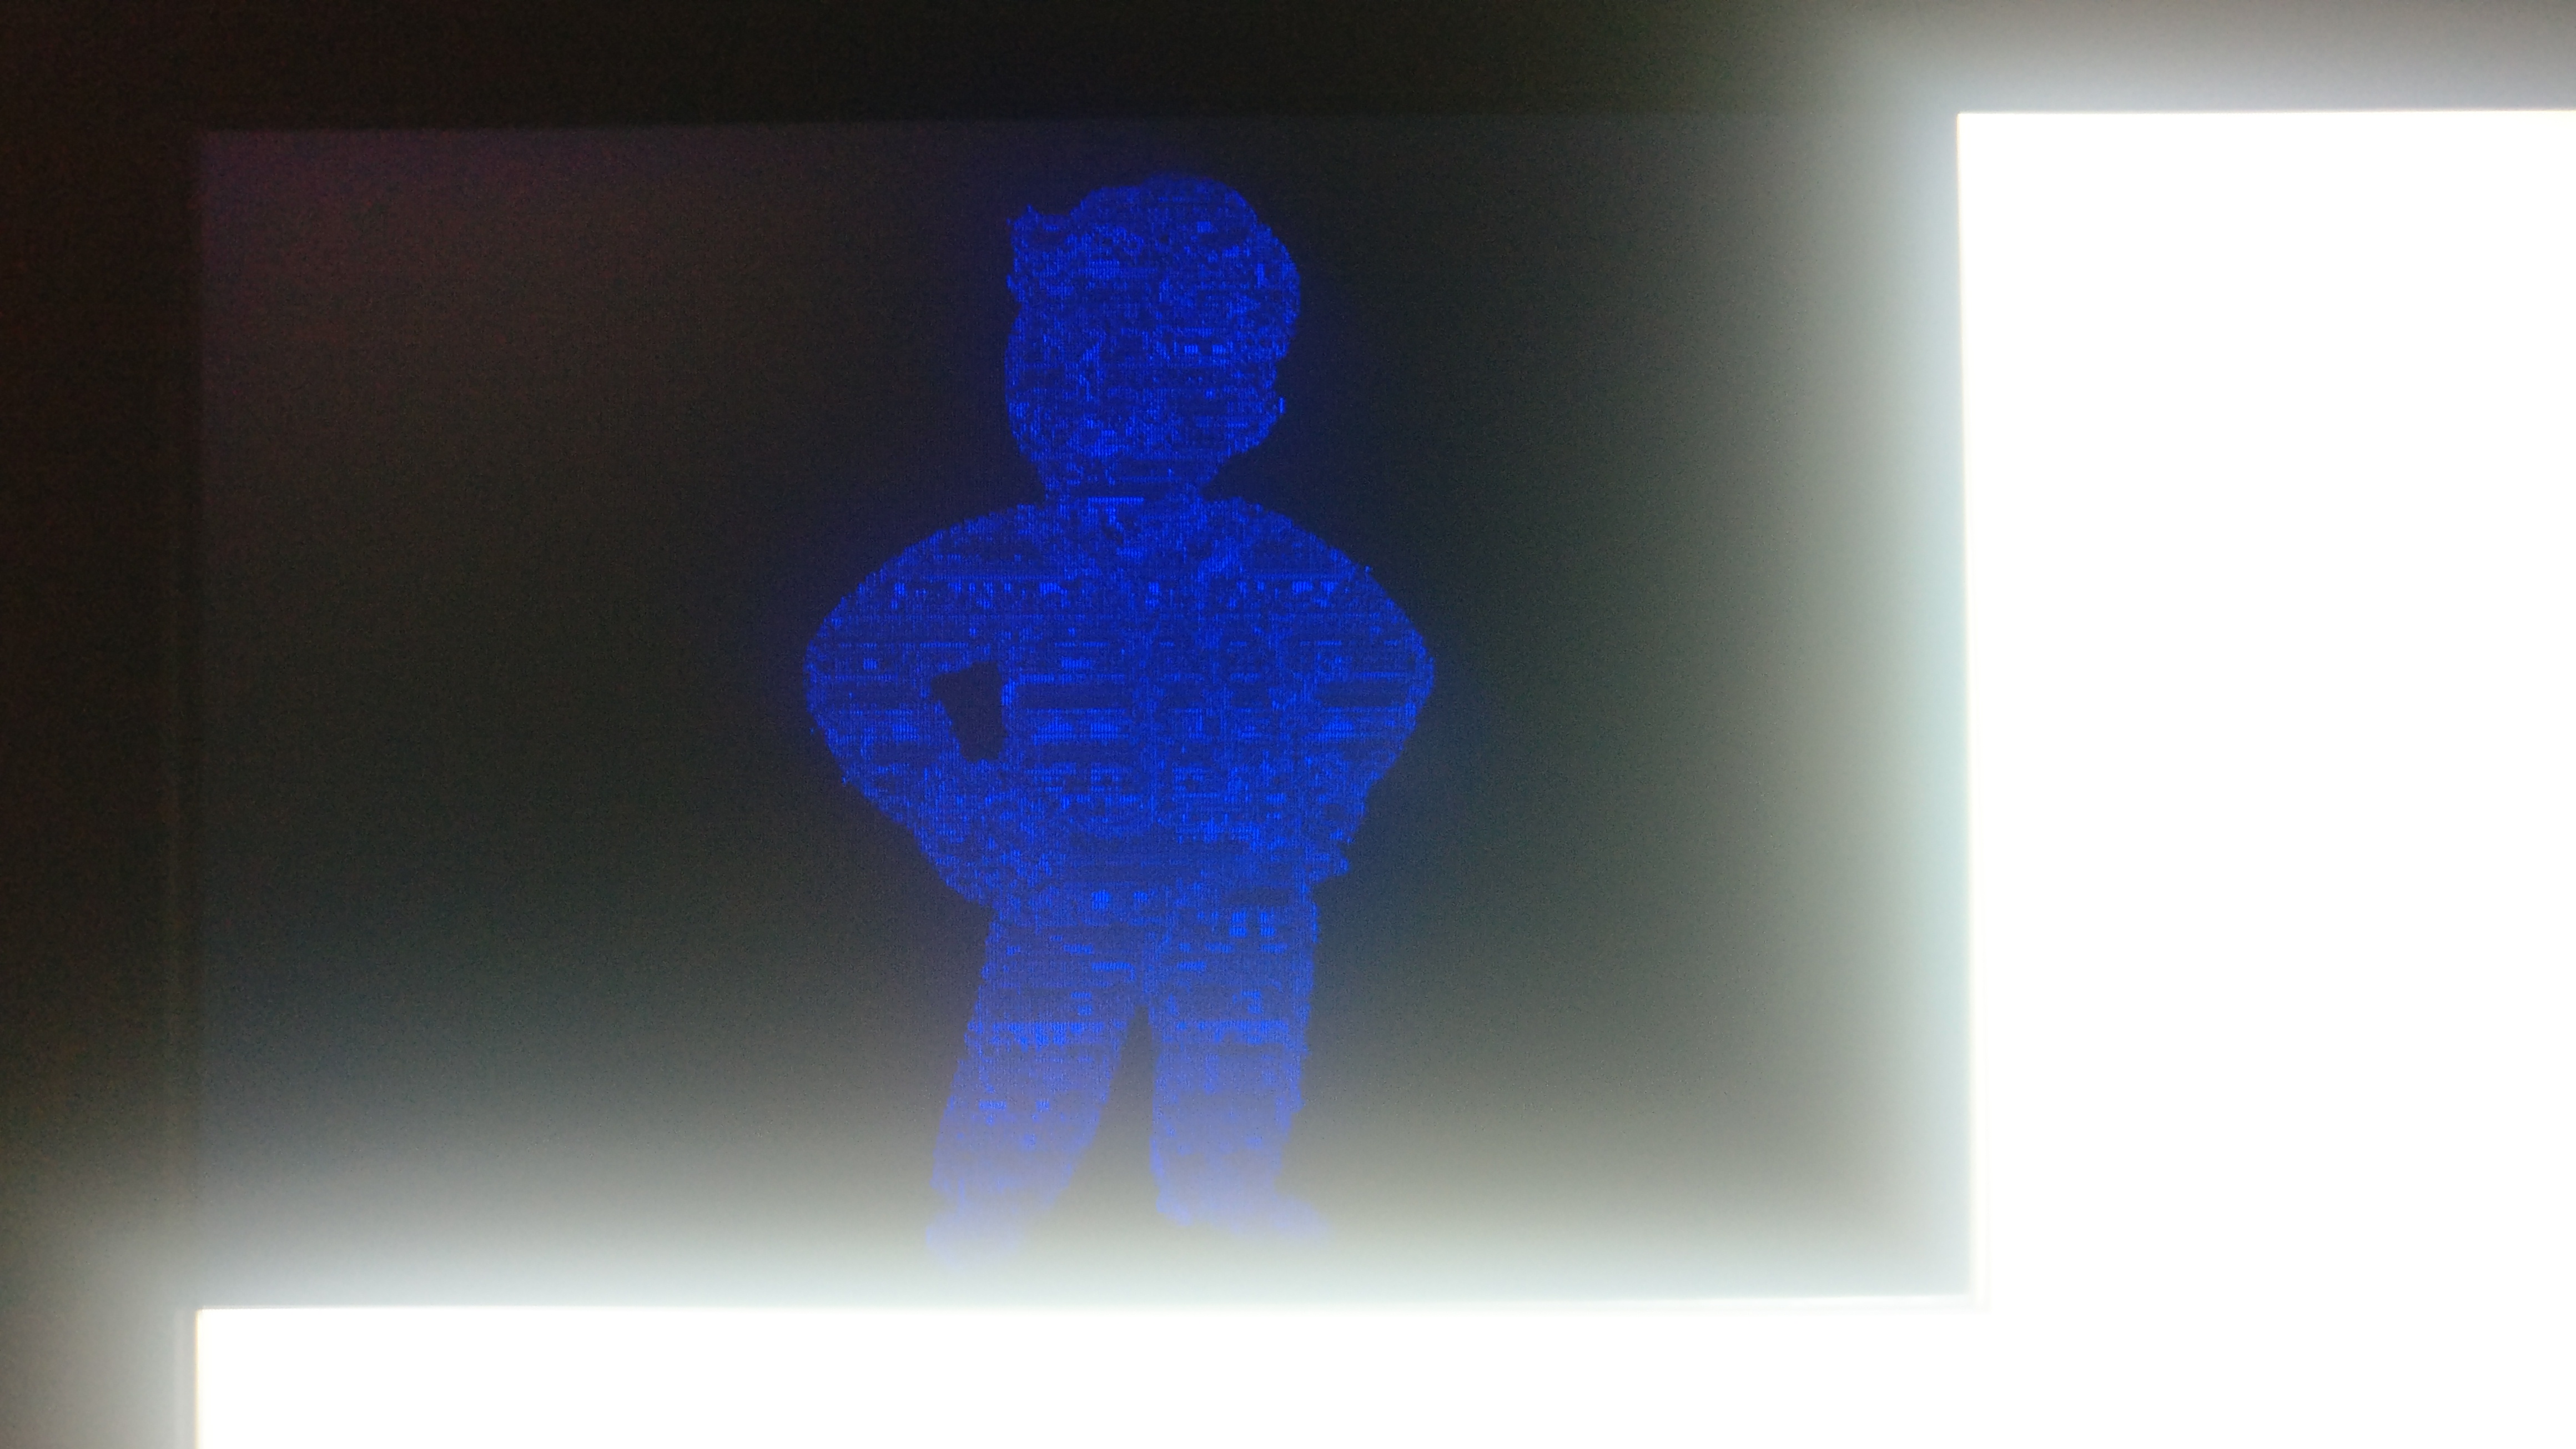
Hi there. I’m starting to learn the littlevGL library for Linux frame buffer and now I want to display some image, but the colors are distorted. Maybe someone knows what it may be, I will be grateful for the help.
What does the original image look like?
/home/neboron/Изображения/VB_frame_000.png
LV_IMG_DECLARE(vault_boy_frame_001)

lv_obj_t * img_var = lv_img_create(lv_scr_act(), NULL); /*Crate an image object*/
lv_img_set_src(img_var, &vault_boy_frame_001);  /*Set the created file as image */
lv_obj_set_pos(img_var, 0, 0); /*Set the positions*/I assume you’re using the project from https://github.com/littlevgl/lv_port_linux_frame_buffer.
My guess would be that the color depths don’t match between LittlevGL and the framebuffer. When your program starts running the framebuffer’s color depth is printed here. You should confirm that LV_COLOR_DEPTH matches that value.
Thank you for your help, I will check this soon.
Color depth of frame buffer is 32bpp which corresponds to LV_COLOR_DEPTH (32).
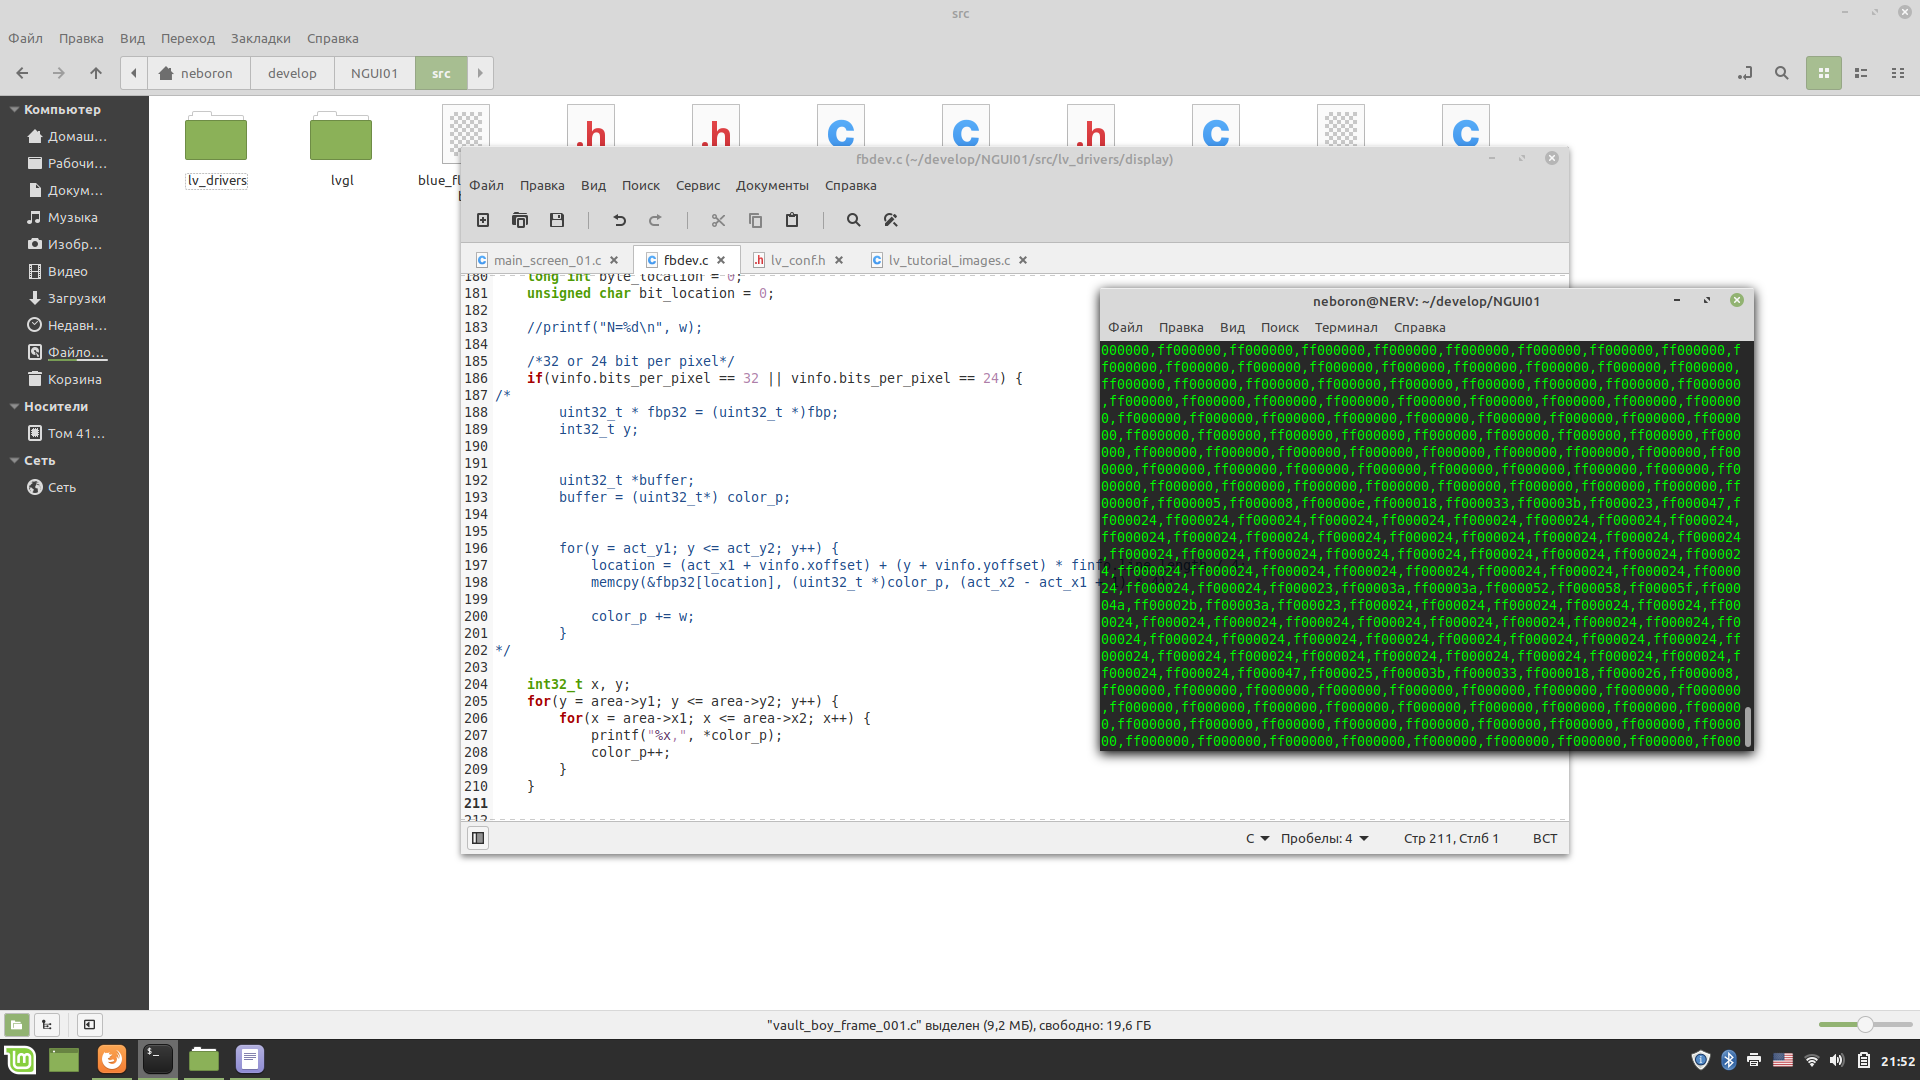
Try printing out the color values that are being sent to the display within your flush_cb function.
If you don’t see anything other than green, black, and white, it means that LittlevGL is rendering properly and your display driver isn’t sending the right colors to the display.
Also, one other thing: what settings did you use to convert the image?
I edited the flush_cb (fbdev_flush) function so that it prints ARGB value. As can be seen from screenshot, the colors is mainly blue, which is a little strange.
Online converter settings: True color, C array.
I checked your PNG file in GIMP and it appears to be using indexed color. Try switching it to RGB and then converting it (the online converter has issues with indexed colors).
Thanks, it really works😅.
I would also like to ask about the charts, how can I set a style to change the background from white, to any other colour?
Or is it better to create a new question?
It’s better to create a new question because it helps those searching using Google, etc. to find the answer quickly. But don’t worry about it now since you’ve already asked.
Have a look at the chart documentation. You need to change style.body.main_color and style.body.grad_color to the new color(s) you want.
I already tried this function, but because of it the program completely stopped working, soon I will try to debug and look for the reason.
Is this the right way to change color? As a result, I get just a black screen.
static lv_style_t style_chart;
style_chart.body.main_color = lv_color_hsv_to_rgb(120, 60, 10);
/*Create a chart with two data lines*/
chart = lv_chart_create(lv_disp_get_scr_act(NULL), NULL);

lv_chart_set_style(chart, LV_CHART_STYLE_MAIN, &style_chart); //apply style

lv_obj_set_size(chart, 1920 / 2, 1280 / 2);
lv_obj_set_pos(chart, 0, 0);
lv_chart_set_point_count(chart, CHART_POINT_NUM);
lv_chart_set_range(chart, 0, 1000);
lv_chart_set_type(chart, LV_CHART_TYPE_LINE);
lv_chart_set_series_width(chart, 2);
lv_chart_set_div_line_count(chart, 9, 9);
lv_chart_set_series_darking(chart, LV_OPA_TRANSP);
acc_x_ser =  lv_chart_add_series(chart, LV_COLOR_RED);
acc_y_ser = lv_chart_add_series(chart, LV_COLOR_BLUE);You should copy an existing style into style_chart and then change the properties you want.
lv_style_copy(&style_chart, lv_chart_get_style(chart, LV_CHART_STYLE_MAIN));
1 Like
Thank you.