Description
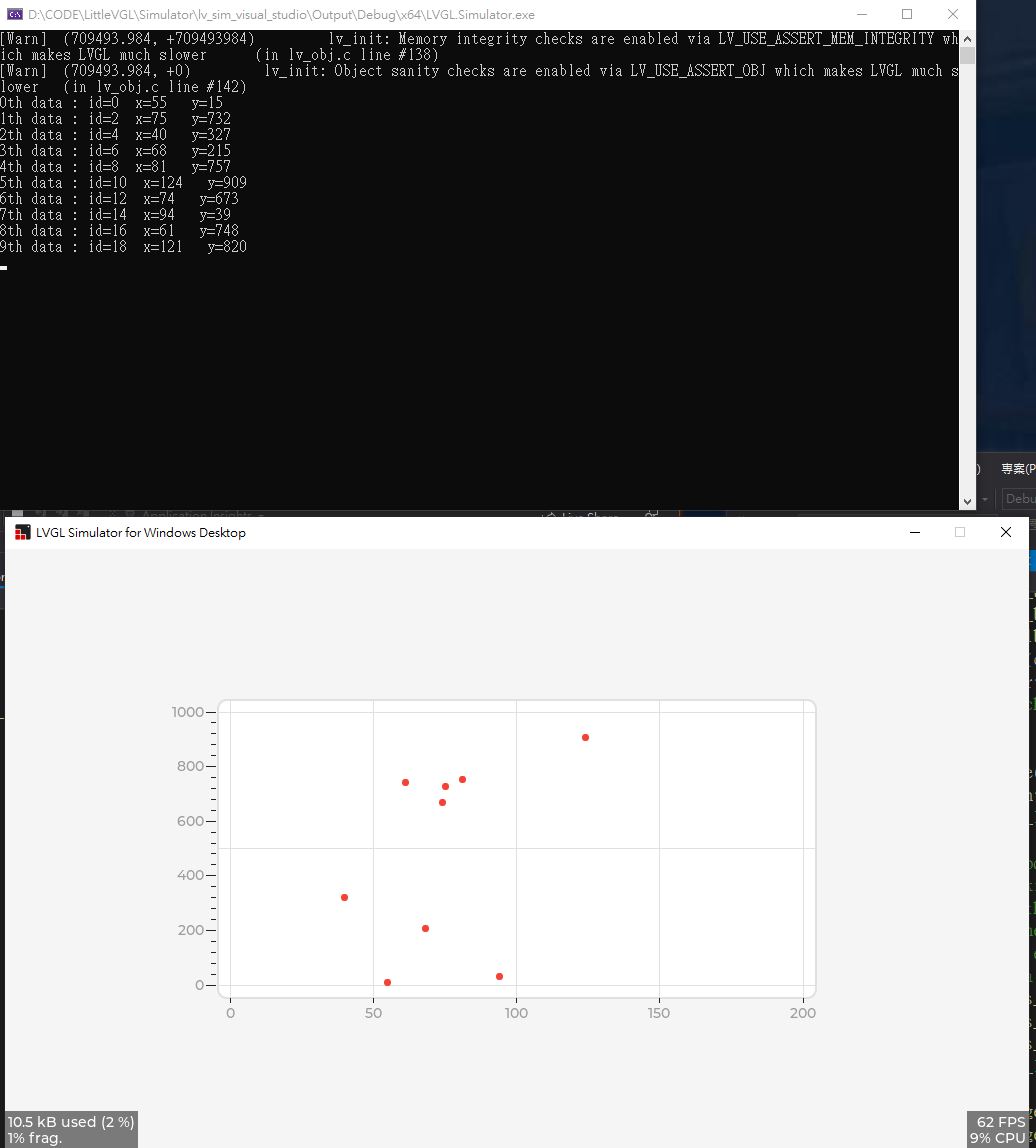
I have a function that is called to plot scatter x-y data on chart. The API function lv_chart_set_next_value2(chart_op, ser_st, x, y) is used to plot data no the chart, is work well :
void plot_st_data(uint16_t x, uint16_t y) {
    uint16_t id_data = x / dt;
    //lv_chart_set_value_by_id2(chart_op, ser_st, id_data, x, y);
    lv_chart_set_next_value2(chart_op, ser_st,  x, y);
    printf("plot data : id=%d , x=%d, y=%d \n", id_data, x, y);
    //lv_chart_refresh(chart_op);
    //lv_refr_now(NULL);
}
In order to modify the specific data, the API
lv_chart_set_next_value2(chart_op, ser_st, x, y)
is replaced with
lv_chart_set_value_by_id2(chart_op, ser_st, id_data, x, y);
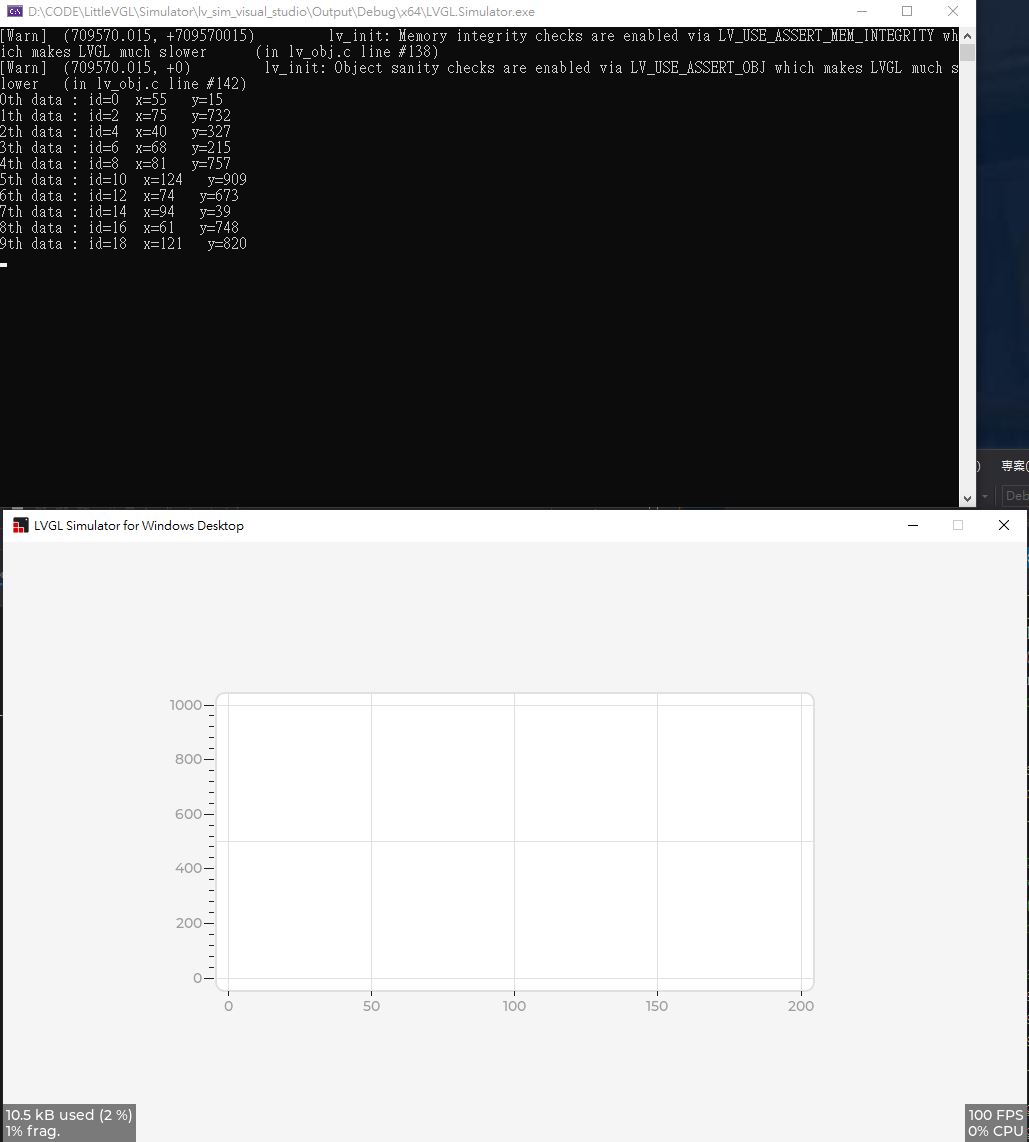
But lv_chart_set_value_by_id2() does not work correctly, there is not thing on the chart.
What MCU/Processor/Board and compiler are you using?
VisualStudio Simulator
What LVGL version are you using?
v8.0
What do you want to achieve?
Use the API lv_chart_set_value_by_id2(chart_op, ser_st, id_data, x, y) to plot chart, hence the specific data can be modified via id_data.
What have you tried so far?
I replace lv_chart_set_next_value2(chart_op, ser_st, x, y);
with
lv_chart_set_value_by_id2(chart_op, ser_st, id_data, x, y);
But it does not work correctly.
BTW, I have checked the API lv_chart_set_value_by_id2(chart_op, ser_st, id_data, x, y); in lv_example_chart_7, It’s work correctly!
Code to reproduce
void plot_st_data(uint16_t x, uint16_t y) {
    uint16_t id_data = x / dt;
    lv_chart_set_value_by_id2(chart_op, ser_st, id_data, x, y);
    //lv_chart_set_next_value2(chart_op, ser_st,  x, y);
    printf("plot data : id=%d , x=%d, y=%d \n", id_data, x, y);
    lv_chart_refresh(chart_op);
    lv_refr_now(NULL);
}
Thanks for your suggestion, Best Wishes.