How to set axis label of a chart?

Description

I want to set a chart’s x-axis label, I followed the doc guidance but it doesn’t what I need.The picture I uploaded below is what I expect.

What MCU/Processor/Board and compiler are you using?

What do you want to achieve?

1.how to add the axis label?
2.how to add the scale line shown in the picture?

What have you tried so far?

Code to reproduce

Add a code snippet which can run in the simulator. It should contain only the relevant code that compiles without errors when separated from your main code base.

The code block(s) should be formatted like:

const char* x_axis_label = "2\n3\n5\n\6\n7\n8\n9\n10\n11\n12\n13\n14\n15\n16\n"
        "17\n18\n19\n20\n21\n22\n23\n24\n25\n26\n27\n28\n29\n30\n31\n";
lv_chart_set_x_tick_texts(harmonic_chart, x_axis_label, 30, LV_CHART_AXIS_DRAW_LAST_TICK);

Screenshot and/or video

.

I add the 2 funcitons, but it still show nothing about texts.Here is my code:

const char* x_axis_label = "2\n3\n5\n\6\n7\n8\n9\n10\n11\n12\n13\n14\n15\n16\n"
        "17\n18\n19\n20\n21\n22\n23\n24\n25\n26\n27\n28\n29\n30\n31\n";

static bool Create_Harmonic_Chart(lv_obj_t* parent)
{
    static lv_style_t style_Harmonic_Chart;
    lv_style_copy(&style_Harmonic_Chart, &lv_style_transp);
    style_Harmonic_Chart.body.opa = LV_OPA_TRANSP;
    style_Harmonic_Chart.body.main_color = LV_COLOR_WHITE;
    style_Harmonic_Chart.body.grad_color = LV_COLOR_WHITE;
    style_Harmonic_Chart.body.radius = 0;
    style_Harmonic_Chart.body.border.part = LV_BORDER_TOP | LV_BORDER_BOTTOM;
    style_Harmonic_Chart.body.border.width = 2;
    style_Harmonic_Chart.body.border.color = lv_color_make(204, 204, 204);
    style_Harmonic_Chart.body.border.opa = LV_OPA_COVER;
    style_Harmonic_Chart.line.color = LV_COLOR_GRAY;
    style_Harmonic_Chart.line.width = 1;
    style_Harmonic_Chart.line.opa = LV_OPA_COVER;
    style_Harmonic_Chart.line.color = lv_color_make(204, 204, 204);
    style_Harmonic_Chart.text.color = lv_color_make(133, 133, 133);
    style_Harmonic_Chart.text.opa = LV_OPA_COVER;
    style_Harmonic_Chart.text.letter_space = 5;
    /* 创建图表样式 */
    harmonic_chart = lv_chart_create(parent, NULL);
    lv_obj_set_size(harmonic_chart, CHART_HARMONIC_WIDTH, CHART_HARMONIC_HEIGHT);
    lv_obj_align(harmonic_chart, NULL, LV_ALIGN_CENTER, 0, -20);
    lv_chart_set_style(harmonic_chart, LV_CHART_STYLE_MAIN, &style_Harmonic_Chart);
    lv_chart_set_div_line_count(harmonic_chart, 1, 0);
    lv_chart_set_range(harmonic_chart, 0, 100);

    lv_chart_set_point_count(harmonic_chart, 30);
    lv_chart_set_type(harmonic_chart, LV_CHART_TYPE_COLUMN);
    lv_chart_set_series_opa(harmonic_chart, LV_OPA_COVER);
    lv_chart_set_series_darking(harmonic_chart, LV_OPA_TRANSP);
    lv_chart_set_series_width(harmonic_chart, 4);
    lv_chart_set_margin(harmonic_chart, 20);
    lv_chart_set_x_tick_length(harmonic_chart, 30, 20);
    lv_chart_set_x_tick_texts(harmonic_chart, x_axis_label, 1, LV_CHART_AXIS_SKIP_LAST_TICK);

    HD_Data = lv_chart_add_series(harmonic_chart, lv_color_make(100, 200, 100));
    HD_Data->points[0] = 90;
    HD_Data->points[1] = 80;
    HD_Data->points[2] = 70;
    HD_Data->points[3] = 60;
    HD_Data->points[4] = 50;
    HD_Data->points[5] = 40;
    HD_Data->points[6] = 30;
    HD_Data->points[7] = 20;
    HD_Data->points[8] = 12;
    HD_Data->points[9] = 11;
    HD_Data->points[10] = 10;
    HD_Data->points[11] = 9;
    HD_Data->points[12] = 9;
    HD_Data->points[13] = 9;
    HD_Data->points[14] = 9;
    HD_Data->points[15] = 9;
    HD_Data->points[16] = 8;
    HD_Data->points[17] = 8;
    HD_Data->points[18] = 8;
    HD_Data->points[19] = 8;
    HD_Data->points[20] = 7;
    HD_Data->points[21] = 7;
    HD_Data->points[22] = 7;
    HD_Data->points[23] = 6;
    HD_Data->points[24] = 6;
    HD_Data->points[25] = 5;
    HD_Data->points[26] = 4;
    HD_Data->points[27] = 3;
    HD_Data->points[28] = 2;
    HD_Data->points[29] = 1;

    lv_chart_refresh(harmonic_chart);

    return true;
}

and I have another 2 questions shown below.
![demo|690x322](upload://hYrFSeQIGOx7jgxYZxzTez7VBIw.png) 

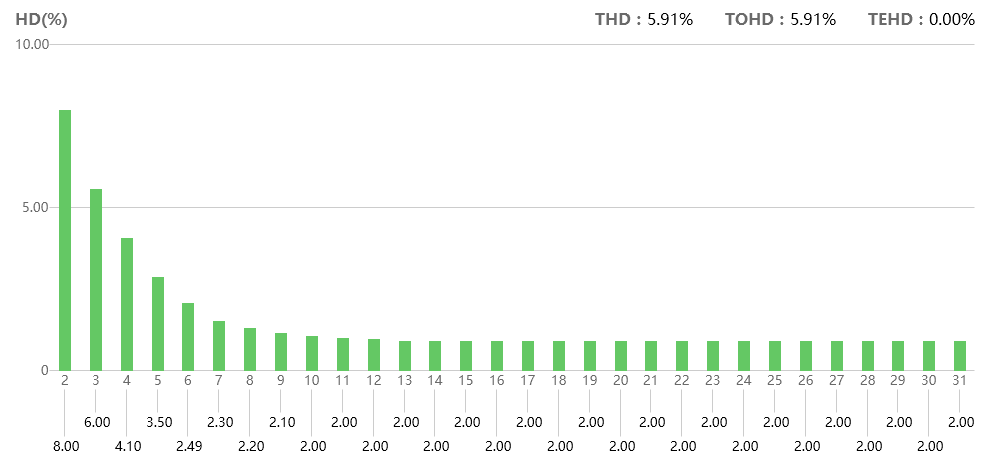
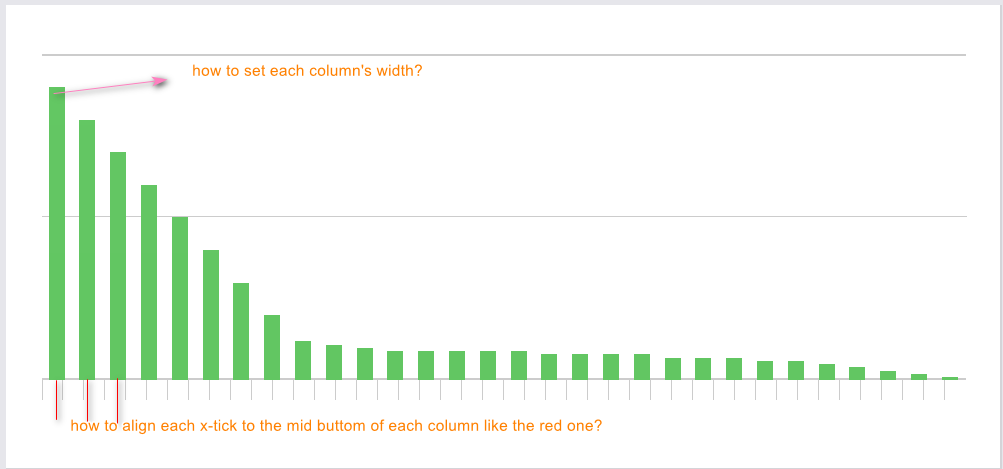
hi, I adjust my code, and now it can show axis label, like the picture I uploaded.But it seems doesn’t align with the column,how to adjust it .

here is my code

static bool Create_Harmonic_Chart(lv_obj_t* parent)
{
   static lv_style_t style_Harmonic_Chart;
   lv_style_copy(&style_Harmonic_Chart, &lv_style_transp);
   style_Harmonic_Chart.body.opa = LV_OPA_TRANSP;
   style_Harmonic_Chart.body.main_color = LV_COLOR_WHITE;
   style_Harmonic_Chart.body.grad_color = LV_COLOR_WHITE;
   style_Harmonic_Chart.body.radius = 0;
   style_Harmonic_Chart.body.border.part = LV_BORDER_TOP | LV_BORDER_BOTTOM;
   style_Harmonic_Chart.body.border.width = 2;
   style_Harmonic_Chart.body.border.color = lv_color_make(204, 204, 204);
   style_Harmonic_Chart.body.border.opa = LV_OPA_COVER;
   style_Harmonic_Chart.line.color = LV_COLOR_GRAY;
   style_Harmonic_Chart.line.width = 1;
   style_Harmonic_Chart.line.opa = LV_OPA_COVER;
   style_Harmonic_Chart.line.color = lv_color_make(204, 204, 204);
   style_Harmonic_Chart.text.color = lv_color_make(133, 133, 133);
   style_Harmonic_Chart.text.opa = LV_OPA_COVER;
   style_Harmonic_Chart.text.font = &lv_font_custom_simhei_FontAwesome_14;
   /* 创建图表样式 */
   harmonic_chart = lv_chart_create(parent, NULL);
   lv_obj_set_size(harmonic_chart, CHART_HARMONIC_WIDTH, CHART_HARMONIC_HEIGHT);
   lv_obj_align(harmonic_chart, NULL, LV_ALIGN_CENTER, 20, -20);
   lv_chart_set_style(harmonic_chart, LV_CHART_STYLE_MAIN, &style_Harmonic_Chart);
   lv_chart_set_div_line_count(harmonic_chart, 1, 0);
   lv_chart_set_range(harmonic_chart, 0, 100);

   lv_chart_set_point_count(harmonic_chart, 30);
   lv_chart_set_type(harmonic_chart, LV_CHART_TYPE_COLUMN);
   lv_chart_set_series_opa(harmonic_chart, LV_OPA_COVER);
   lv_chart_set_series_darking(harmonic_chart, LV_OPA_TRANSP);
   lv_chart_set_series_width(harmonic_chart, 4);
   lv_chart_set_margin(harmonic_chart, 60);
   lv_chart_set_x_tick_texts(harmonic_chart, "2\n3\n4\n5\n6\n7\n8\n9\n10\n11\n12\n13\n14\n15\n16\n17\n18\n19\n20\n21\n22\n23\n24\n25\n26\n27\n28\n29\n30\n31",
           1, LV_CHART_AXIS_SKIP_LAST_TICK);
   lv_chart_set_x_tick_length(harmonic_chart, 5, 8);
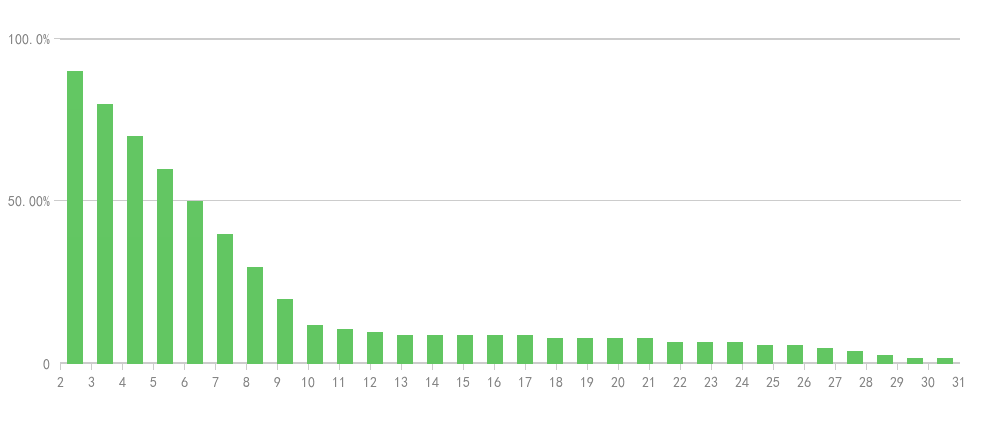
   lv_chart_set_y_tick_texts(harmonic_chart,"100.0%\n50.00%\n0", 1, LV_CHART_AXIS_SKIP_LAST_TICK);
   lv_chart_set_y_tick_length(harmonic_chart, 5, 8);

   HD_Data = lv_chart_add_series(harmonic_chart, lv_color_make(100, 200, 100));
   HD_Data->points[0] = 90;
   HD_Data->points[1] = 80;
   HD_Data->points[2] = 70;
   HD_Data->points[3] = 60;
   HD_Data->points[4] = 50;
   HD_Data->points[5] = 40;
   HD_Data->points[6] = 30;
   HD_Data->points[7] = 20;
   HD_Data->points[8] = 12;
   HD_Data->points[9] = 11;
   HD_Data->points[10] = 10;
   HD_Data->points[11] = 9;
   HD_Data->points[12] = 9;
   HD_Data->points[13] = 9;
   HD_Data->points[14] = 9;
   HD_Data->points[15] = 9;
   HD_Data->points[16] = 8;
   HD_Data->points[17] = 8;
   HD_Data->points[18] = 8;
   HD_Data->points[19] = 8;
   HD_Data->points[20] = 7;
   HD_Data->points[21] = 7;
   HD_Data->points[22] = 7;
   HD_Data->points[23] = 6;
   HD_Data->points[24] = 6;
   HD_Data->points[25] = 5;
   HD_Data->points[26] = 4;
   HD_Data->points[27] = 3;
   HD_Data->points[28] = 2;
   HD_Data->points[29] = 2;
//    HD_Data->points[30] = 2;

   lv_chart_refresh(harmonic_chart);

   return true;
}

Add “\n” before and after at any value in x-tick-text and
set lv_chart_axis_options_t use by LV_CHART_AXIS_SKIP_LAST_TICK

Code

Example : The chart show 7 columns

...
lv_chart_set_point_count(chart, 7);
lv_chart_set_x_tick_texts(chart, "\n1\n\n2\n\n3\n\n4\n\n5\n\n6\n\n7\n", 1,
                                 LV_CHART_AXIS_SKIP_LAST_TICK);
...

Result

capture_00058


For another issue about column’s width,
It can’t change, it is automatically calculated by the widget.

1 Like