What do you want to achieve?
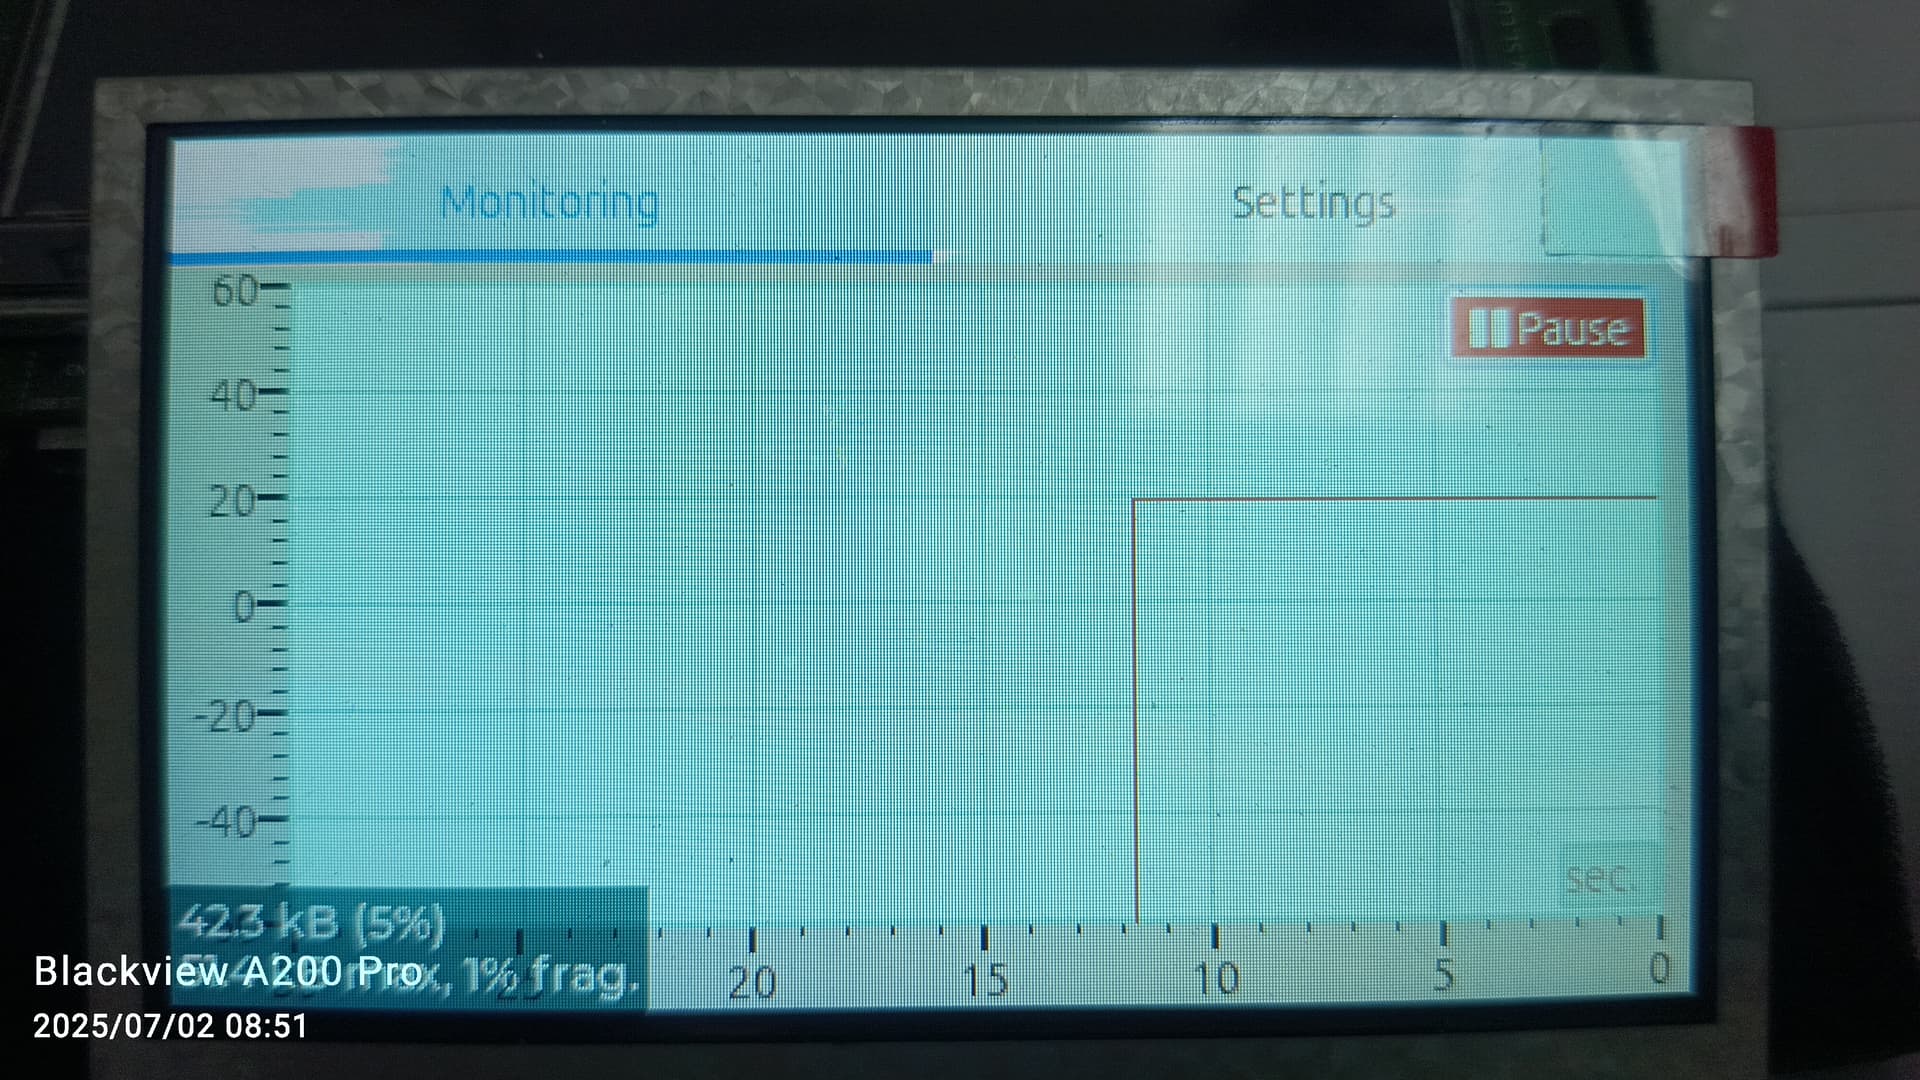
Where does the vertical line appear, how to remove it. Refreshing occurs every 100 ms, in test mode I refresh the chart with a value of 20.
What have you tried so far?
I have tried erasing all the dots without much success.
lv_chart_set_all_value(obj, ser, LV_CHART_POINT_NONE);
Code to reproduce
/// initialization
            lv_chart_set_type(obj, LV_CHART_TYPE_LINE);

            auto points = Param_Manager_c::getValue("data_points_online");
            const uint32_t max_points = points * 2;
            lv_chart_set_point_count(obj, max_points);

            lv_obj_set_style_pad_all(obj, 0, 0);
            lv_obj_set_style_radius(obj, 0, 0);
            lv_obj_set_style_size(obj, 0, 0, LV_PART_INDICATOR);

            lv_chart_set_div_line_count(obj, 7, 7);

            auto val_min_Y = Param_Manager_c::getValue("data_scale_chart_min_on");
            auto val_max_Y = Param_Manager_c::getValue("data_scale_chart_max_on");
            lv_chart_set_range(obj, LV_CHART_AXIS_PRIMARY_Y, val_min_Y, val_max_Y);

            auto ser = lv_chart_add_series(obj, lv_palette_main(LV_PALETTE_RED), LV_CHART_AXIS_PRIMARY_Y);

            lv_obj_set_style_line_width(obj, 1, LV_PART_ITEMS);   /*Remove the lines*/

            auto scale_left = Widget_Manager_c::getWidget("scale_chart_ver_online");
            lv_scale_set_range(scale_left, val_min_Y, val_max_Y);
            lv_obj_set_style_pad_ver(scale_left, lv_chart_get_first_point_center_offset(obj), 0);

            auto scale_gor = Widget_Manager_c::getWidget("scale_chart_hor_online");
            auto val = Param_Manager_c::getValue("chart_period_signal");
            lv_scale_set_range(scale_gor, timeArray[val], 0);

            auto time_lb = Widget_Manager_c::getWidget("chart_text_area_time");
            lv_textarea_set_text(time_lb, TimeCodes[val].c_str());

            lv_chart_set_all_value(obj, ser, LV_CHART_POINT_NONE);

///Update
           for (size_t i = 0; i < validCount && cnt < max_points; ++i)
           {
                    lv_chart_set_value_by_id(chart, ser, cnt--, 20.0f);
                    lv_chart_set_value_by_id(chart, ser, cnt--, 20.0f);

                    if (cnt == 0) {
                        trace_printf("Chart_trand_view::update: Reached max points (%d)\n", max_points);
                        break;
                    }
             }
Screenshot and/or video
Environment
- MCU/MPU/Board: stm32h743
- LVGL version: #define LVGL_VERSION_MAJOR 9
#define LVGL_VERSION_MINOR 3
#define LVGL_VERSION_PATCH 0
#define LVGL_VERSION_INFO “dev”