How to plot temperature sensor data with lvgl chart?

Hi lvgl community,

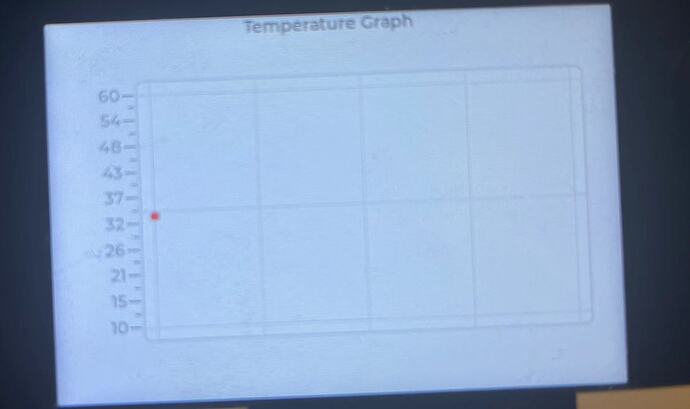
i’m a complete beginner with LVGL lib, and i intend to plot a temperature reading data on my display using the lv_chart , I’m using esp32 board, so far , the data point seems to show temperature along the x axis but does not show in y axis continously ,

I have spent a lot of time searching solution online and i found this demo, which is using stm32

and bellow is the undesired results,

is there any help on how to plot the graph periodically?

and here is my code

static void TemperatureChart( void )
{
  uint16_t idx = 0u;
  // this should match with the temperature buffer length
  uint16_t chart_hor_res = 260;
  uint16_t chart_ver_res = lv_disp_get_ver_res(NULL) - 100;
  int16_t data = 20;
  lv_obj_clean( lv_scr_act() );                         // Clean the screen
  // Create a chart object
  chart = lv_chart_create( lv_scr_act() );
  // Create a label for Title text
  lv_obj_t * lbl_title = lv_label_create( lv_scr_act() );
  lv_label_set_text( lbl_title, "Temperature Graph");
  lv_obj_set_style_text_align( lbl_title, LV_TEXT_ALIGN_CENTER, 0);
  lv_obj_align( lbl_title, LV_ALIGN_TOP_MID, 0, 0 );
  lv_obj_add_style( lbl_title, &style, 0 );
  lv_obj_set_size( chart, (lv_disp_get_hor_res(NULL) - 100), chart_ver_res );
  // TODO: XS I don't want to center it, will check later
  // lv_obj_center( chart );
  lv_obj_align( chart, LV_ALIGN_CENTER, LV_PCT(5), 0 );
  // lv_obj_align( chart, LV_ALIGN_BOTTOM_RIGHT, 0, 0 );
  // Set Chart Type to Line Chart
  lv_chart_set_type( chart, LV_CHART_TYPE_LINE );
  // By Default the number of points are 10, update it to chart width
  lv_chart_set_point_count( chart, chart_hor_res );
  // Update mode shift or circular, here shift is selected
  lv_chart_set_update_mode( chart, LV_CHART_UPDATE_MODE_SHIFT );
  // Specify Vertical Range
  lv_chart_set_range( chart, LV_CHART_AXIS_PRIMARY_Y, 10, 60);
  lv_chart_set_axis_tick(chart, LV_CHART_AXIS_PRIMARY_Y, 10, 5, 10, 2, true, 50);
  temp_series = lv_chart_add_series(chart, lv_palette_main(LV_PALETTE_RED), LV_CHART_AXIS_PRIMARY_Y);


  for( idx=0; idx<sizeof(temp_sensor); idx++ )
  {
    temp_series->y_points[idx] = (lv_coord_t)(temp_sensor);
  }

  lv_chart_refresh(chart); /*Required after direct set*/
}
static void TemperatureChartRefresh(void)
{
  uint16_t idx = 0;
  // this should match with the temperature buffer length
  uint16_t chart_hor_res = 260;

  for( idx=0; idx<sizeof(temp_sensor);idx++)
  {
    temp_series->y_points[idx] = (lv_coord_t)(temp_sensor);
  }
  lv_chart_refresh(chart); /*Required after direct set*/
}

Hi, I would suggest you start with a simple example of plotting points on the chart, they are also available on LVGL documentation page.
Chart (lv_chart) — LVGL documentation

#include "../../../lv_examples.h"
#if LV_USE_CHART

void lv_ex_chart_1(void)
{
    /*Create a chart*/
    lv_obj_t * chart;
    chart = lv_chart_create(lv_scr_act(), NULL);
    lv_obj_set_size(chart, 200, 150);
    lv_obj_align(chart, NULL, LV_ALIGN_CENTER, 0, 0);
    lv_chart_set_type(chart, LV_CHART_TYPE_LINE);   /*Show lines and points too*/

    /*Add two data series*/
    lv_chart_series_t * ser1 = lv_chart_add_series(chart, LV_COLOR_RED);
    lv_chart_series_t * ser2 = lv_chart_add_series(chart, LV_COLOR_GREEN);

    /*Set the next points on 'ser1'*/
    lv_chart_set_next(chart, ser1, 10);
    lv_chart_set_next(chart, ser1, 10);
    lv_chart_set_next(chart, ser1, 10);
    lv_chart_set_next(chart, ser1, 10);
    lv_chart_set_next(chart, ser1, 10);
    lv_chart_set_next(chart, ser1, 10);
    lv_chart_set_next(chart, ser1, 10);
    lv_chart_set_next(chart, ser1, 30);
    lv_chart_set_next(chart, ser1, 70);
    lv_chart_set_next(chart, ser1, 90);

    /*Directly set points on 'ser2'*/
    ser2->points[0] = 90;
    ser2->points[1] = 70;
    ser2->points[2] = 65;
    ser2->points[3] = 65;
    ser2->points[4] = 65;
    ser2->points[5] = 65;
    ser2->points[6] = 65;
    ser2->points[7] = 65;
    ser2->points[8] = 65;
    ser2->points[9] = 65;

    lv_chart_refresh(chart); /*Required after direct set*/
}

#endif

Start with this and move to a complex topic.
In the link you attached above, basically, there are two functions.
The first function just draws the graph/chart, and the second function periodically refreshes the data on the graph/chart.

Display Manager.png (1236×651) (googleusercontent.com)

Even in this activity diagram it is mentioned that Chart will refresh every second, and the reason for that is the temperature values are updated every second.
Use some print statements to understand if your refresh function is getting called or not, and if called how much time it is taking to refresh it.
Again, I will suggest you to use a simple example and then update it refreshing part.


The refresh part from the blog is as below.

static void Display_TemperatureChartRefresh( void )
{
  uint16_t idx = 0u;
  uint8_t *data = Display_GetTempData();
  // this should match with the temperature buffer length
  uint16_t chart_hor_res = 260;

  for( idx=0; idx<chart_hor_res; idx++ )
  {
    temp_series->y_points[idx] = (lv_coord_t)*(data+idx);
  }

  lv_chart_refresh(chart); /*Required after direct set*/
}

But you have updated it like this.

static void TemperatureChartRefresh(void)
{
  uint16_t idx = 0;
  // this should match with the temperature buffer length
  uint16_t chart_hor_res = 260;

  for( idx=0; idx<sizeof(temp_sensor);idx++)
  {
    temp_series->y_points[idx] = (lv_coord_t)(temp_sensor);
  }
  lv_chart_refresh(chart); /*Required after direct set*/
}

I am not able to understand what u wanted to achieve here.
You need to update y_points and you are updating them with just a single value, also you wanted to run the loop how many times? I am asking because you used sizeof(temp_sensor), I think the problem you are facing has nothing to do with LVGL.

Hi @xpress_embedo thanks for your quck response ! i had already gone through the starting example as you suggested and it was very usefull during my initial stage, my only problem was on how to periodicaly plot curve (points) with new incomming sensor data., this part is not clear to me. the code i shared did not solve my problem in in updating new points in the y direction .

Hmmm let me try to help you.
In the main.c file, there is an array, which stores the temperature sensor data.

// the above samples are averaged and stored in the below array
static uint8_t temp_sensor_1sec[260] = { 0 };   // 320-60
static uint16_t temp_sensor_1sec_idx = 0u;

And this contains the sensor data of every second, which means that temp_sensor_1sec[0] contains the 1st second data and temp_sensor_1sec[1] contains the 2nd second sensor data, and so on.
And when 260 seconds has elapsed, it updates the 261th second sensor data again in temp_sensor_1sec[0].
So basically temp_sensor_1sec array contains every second data of the temperature sensor.

And then the function Display_TemperatureChartRefresh is used to update this data, you can periodically call this function, like in above example it is called every 1 second, which makes sense because the sensor data is getting updated every second.

static void Display_TemperatureChartRefresh( void )
{
  uint16_t idx = 0u;
  uint8_t *data = Display_GetTempData();
  // this should match with the temperature buffer length
  uint16_t chart_hor_res = lv_disp_get_hor_res(NULL) - 60;

  for( idx=0; idx<chart_hor_res; idx++ )
  {
    temp_series->y_points[idx] = (lv_coord_t)*(data+idx);
  }

  lv_chart_refresh(chart); /*Required after direct set*/
}

Here we are getting the pointer to the data i.e. temp_sensor_1sec

uint8_t *data = Display_GetTempData();

And then in for loop we are updating the y_points and due to this temperature values will be updated on the chart.

for( idx=0; idx<chart_hor_res; idx++ )
{
  temp_series->y_points[idx] = (lv_coord_t)*(data+idx);
}
1 Like

Thanks much @xpress_embedo for the explaination, it make sense! lastly, can you help me write a simple logic on how to call the fucntion Display_TemperatureChartRefresh every 1 second ?
thanks in advance.

This is already available in the link you have posted, check the complete project on GitHub.
The following piece of code is responsible for this.

    case DISP_STATE_TEMP_SENSOR_REFRESH:
      if( HAL_GetTick()-wait_time > 1000u )
      {
        wait_time = HAL_GetTick();
        // Note: Charts are time consuming
        Display_TemperatureChartRefresh();
      }
      break;

But let’s say you are only interested in chart and not the other stuffs, and assuming you are using Arduino framework, then you can follow the below mentioned approach.

uint32_t refresh_timestamp = 0;
void setup()
{
  // some system configurations according to your project
  Display_TemperatureChart();  // this function will create the chart with no data, because at power-up data is 0  
}
void loop()
{
  if( millis() - refresh_timestamp > 1000 )
  {
    refresh_timestamp = millis();
   // Refresh Chart, this part will be executed every 1second
   Display_TemperatureChartRefresh();
  }
  // same approach for other tasks
}
1 Like

Thanks much!

I’m using ESP IDF , I have to check a timer some how , because there seem to be no millis function,

You can use esp_timer_get_time
And also refer to the following Video
millis alternative in esp-idf - YouTube

And if you are using FreeRTOS then you can simply create a task where you refresh the chart periodically.

1 Like