Hii,
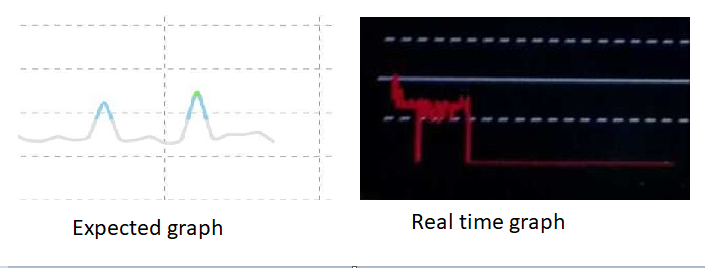
I want to create graph for plotting real time values. So I’m using (Display 1000 data points with zooming and scrolling chart from LVGL. I’m sharing the pics of expected graph & the graph I’m getting.
I’m able to plot values using Y axis, But want to plot points using X axis also. I tried for X axis but its displaying all values in series, where else I want start & end point for plotting. Can anyone tell me is it possible to plot expected graph shown in image in lvgl 8.0 & plotting values as per x axis?
Hey,
Does the “Expected graph” is really made of 1000 points? It should look better if you set e.g. lv_chart_set_point_count(chart, 30);
The expected graph is not of 1000 points. My query behind attaching the expected graph is if no data is present , then it should not plot it to zero. But in real time graph when no data is present it is plotting to zero. So is there any method to Only plot the samples , and if no sample present it should not plot to zero. Thanks @kisvegabor for responding to my doubts.
I tried lv_chart_set_point_count(chart, 30); this API but no use. Irrespective of using it or not getting the same results.
Yes! LV_CHART_POINT_NONE is a special value to indicate that no point should be drawn.
Okay I will try this API. Thanks @kisvegabor