Description
In the past version, it seems that lv_chart_set_series_width () can be used to change the thickness of lines, but in the latest version, LV_STYLE_LINE seems to be a combination of points and lines. How can I use the chart widget to show a single line without points?
What MCU/Processor/Board and compiler are you using?
STM32
What LVGL version are you using?
V7.10.1
What do you want to achieve?
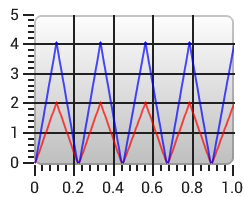
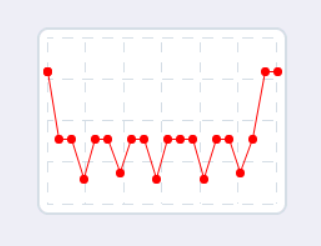
Show a single curve like that in the pictures.
What have you tried so far?
Code to reproduce
Add a code snippet which can run in the simulator. It should contain only the relevant code that compiles without errors when separated from your main code base.
The code block(s) should be formatted like:
/*You code here*/
Screenshot and/or video
If possible, add screenshots and/or videos about the current state.