How To Get Graph Example Working?

Description

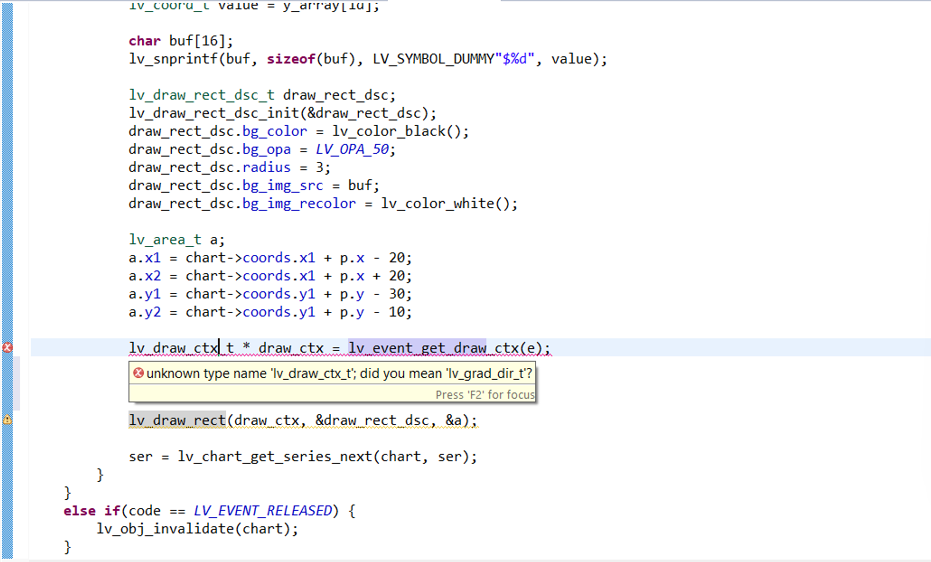
Hi all, I’m trying to replicate a chart example I’ve seen in LVGL’s documentation. For reference, the example is called “Show cursor on the clicked point” and here’s the link to the page containing the example: Chart (lv_chart) — LVGL documentation. However, when I try to run the code, it gives me the error seen in the screenshot below - lv_draw_ctx_t is an unrecognized type.

What MCU/Processor/Board and compiler are you using?

Xilinx Zynq Development Board running eclipse through Xilinx SDK

What LVGL version are you using?

8.1

What do you want to achieve?

I want to get the graph example to work so that when a user clicks on a point, a label will pop up indicating which point they clicked and cursors will be drawn to identify the axis (just like in the example).

What have you tried so far?

I tried creating a label and ditching the lv_draw_ctx_t call altogether but that solution was not as elegant and does not give me the cursors.

Code to reproduce

Add a code snippet which can run in the simulator. It should contain only the relevant code that compiles without errors when separated from your main code base.

The code block(s) should be formatted like:

#include "../../lv_examples.h"
#if LV_USE_CHART && LV_BUILD_EXAMPLES

static lv_obj_t * chart;
static lv_chart_series_t * ser;
static lv_chart_cursor_t * cursor;

static void event_cb(lv_event_t * e)
{
    static int32_t last_id = -1;
    lv_event_code_t code = lv_event_get_code(e);
    lv_obj_t * obj = lv_event_get_target(e);

    if(code == LV_EVENT_VALUE_CHANGED) {
        last_id = lv_chart_get_pressed_point(obj);
        if(last_id != LV_CHART_POINT_NONE) {
            lv_chart_set_cursor_point(obj, cursor, NULL, last_id);
        }
    }
    else if(code == LV_EVENT_DRAW_PART_END) {
        lv_obj_draw_part_dsc_t * dsc = lv_event_get_draw_part_dsc(e);
        if(!lv_obj_draw_part_check_type(dsc, &lv_chart_class, LV_CHART_DRAW_PART_CURSOR)) return;
        if(dsc->p1 == NULL || dsc->p2 == NULL || dsc->p1->y != dsc->p2->y || last_id < 0) return;

        lv_coord_t * data_array = lv_chart_get_y_array(chart, ser);
        lv_coord_t v = data_array[last_id];
        char buf[16];
        lv_snprintf(buf, sizeof(buf), "%d", v);

        lv_point_t size;
        lv_txt_get_size(&size, buf, LV_FONT_DEFAULT, 0, 0, LV_COORD_MAX, LV_TEXT_FLAG_NONE);

        lv_area_t a;
        a.y2 = dsc->p1->y - 5;
        a.y1 = a.y2 - size.y - 10;
        a.x1 = dsc->p1->x + 10;
        a.x2 = a.x1 + size.x + 10;

        lv_draw_rect_dsc_t draw_rect_dsc;
        lv_draw_rect_dsc_init(&draw_rect_dsc);
        draw_rect_dsc.bg_color = lv_palette_main(LV_PALETTE_BLUE);
        draw_rect_dsc.radius = 3;

        lv_draw_rect(dsc->draw_ctx, &draw_rect_dsc, &a);

        lv_draw_label_dsc_t draw_label_dsc;
        lv_draw_label_dsc_init(&draw_label_dsc);
        draw_label_dsc.color = lv_color_white();
        a.x1 += 5;
        a.x2 -= 5;
        a.y1 += 5;
        a.y2 -= 5;
        lv_draw_label(dsc->draw_ctx, &draw_label_dsc, &a, buf, NULL);
    }
}

/**
 * Show cursor on the clicked point
 */
void lv_example_chart_6(void)
{
    chart = lv_chart_create(lv_scr_act());
    lv_obj_set_size(chart, 200, 150);
    lv_obj_align(chart, LV_ALIGN_CENTER, 0, -10);

    lv_chart_set_axis_tick(chart, LV_CHART_AXIS_PRIMARY_Y, 10, 5, 6, 5, true, 40);
    lv_chart_set_axis_tick(chart, LV_CHART_AXIS_PRIMARY_X, 10, 5, 10, 1, true, 30);

    lv_obj_add_event_cb(chart, event_cb, LV_EVENT_ALL, NULL);
    lv_obj_refresh_ext_draw_size(chart);

    cursor = lv_chart_add_cursor(chart, lv_palette_main(LV_PALETTE_BLUE), LV_DIR_LEFT | LV_DIR_BOTTOM);

    ser = lv_chart_add_series(chart, lv_palette_main(LV_PALETTE_RED), LV_CHART_AXIS_PRIMARY_Y);
    uint32_t i;
    for(i = 0; i < 10; i++) {
        lv_chart_set_next_value(chart, ser, lv_rand(10, 90));
    }

    lv_chart_set_zoom_x(chart, 500);

    lv_obj_t * label = lv_label_create(lv_scr_act());
    lv_label_set_text(label, "Click on a point");
    lv_obj_align_to(label, chart, LV_ALIGN_OUT_TOP_MID, 0, -5);
}

#endif

Screenshot and/or video

As a separate note, I also had a question about the “Display 1000 data points with zooming and scrolling” example on the lv_chart page. When I drag the vertical slider up is there anyway, the graph can zoom down to the data points instead of zooming upwards because I always lose my position and have to scroll down right after zooming. @embeddedt if you could help me out with this, that would be amazing! The code is on LVGL’s documentation page but I will also paste it here for reference:

#include "../../lv_examples.h"
#if LV_USE_CHART && LV_USE_SLIDER && LV_BUILD_EXAMPLES

static lv_obj_t * chart;
/* Source: https://github.com/ankur219/ECG-Arrhythmia-classification/blob/642230149583adfae1e4bd26c6f0e1fd8af2be0e/sample.csv*/
static const lv_coord_t ecg_sample[] = {
    -2, 2, 0, -15, -39, -63, -71, -68, -67, -69, -84, -95, -104, -107, -108, -107, -107, -107, -107, -114, -118, -117,
        -112, -100, -89, -83, -71, -64, -58, -58, -62, -62, -58, -51, -46, -39, -27, -10, 4, 7, 1, -3, 0, 14, 24, 30, 25, 19,
        13, 7, 12, 15, 18, 21, 13, 6, 9, 8, 17, 19, 13, 11, 11, 11, 23, 30, 37, 34, 25, 14, 15, 19, 28, 31, 26, 23, 25, 31,
        39, 37, 37, 34, 30, 32, 22, 29, 31, 33, 37, 23, 13, 7, 2, 4, -2, 2, 11, 22, 33, 19, -1, -27, -55, -67, -72, -71, -63,
        -49, -18, 35, 113, 230, 369, 525, 651, 722, 730, 667, 563, 454, 357, 305, 288, 274, 255, 212, 173, 143, 117, 82, 39,
        -13, -53, -78, -91, -101, -113, -124, -131, -131, -131, -129, -128, -129, -125, -123, -123, -129, -139, -148, -153,
        -159, -166, -183, -205, -227, -243, -248, -246, -254, -280, -327, -381, -429, -473, -517, -556, -592, -612, -620,
        -620, -614, -604, -591, -574, -540, -497, -441, -389, -358, -336, -313, -284, -222, -167, -114, -70, -47, -28, -4, 12,
        38, 52, 58, 56, 56, 57, 68, 77, 86, 86, 80, 69, 67, 70, 82, 85, 89, 90, 89, 89, 88, 91, 96, 97, 91, 83, 78, 82, 88, 95,
        96, 105, 106, 110, 102, 100, 96, 98, 97, 101, 98, 99, 100, 107, 113, 119, 115, 110, 96, 85, 73, 64, 69, 76, 79,
        78, 75, 85, 100, 114, 113, 105, 96, 84, 74, 66, 60, 75, 85, 89, 83, 67, 61, 67, 73, 79, 74, 63, 57, 56, 58, 61, 55,
        48, 45, 46, 55, 62, 55, 49, 43, 50, 59, 63, 57, 40, 31, 23, 25, 27, 31, 35, 34, 30, 36, 34, 42, 38, 36, 40, 46, 50,
        47, 32, 30, 32, 52, 67, 73, 71, 63, 54, 53, 45, 41, 28, 13, 3, 1, 4, 4, -8, -23, -32, -31, -19, -5, 3, 9, 13, 19,
        24, 27, 29, 25, 22, 26, 32, 42, 51, 56, 60, 57, 55, 53, 53, 54, 59, 54, 49, 26, -3, -11, -20, -47, -100, -194, -236,
        -212, -123, 8, 103, 142, 147, 120, 105, 98, 93, 81, 61, 40, 26, 28, 30, 30, 27, 19, 17, 21, 20, 19, 19, 22, 36, 40,
        35, 20, 7, 1, 10, 18, 27, 22, 6, -4, -2, 3, 6, -2, -13, -14, -10, -2, 3, 2, -1, -5, -10, -19, -32, -42, -55, -60,
        -68, -77, -86, -101, -110, -117, -115, -104, -92, -84, -85, -84, -73, -65, -52, -50, -45, -35, -20, -3, 12, 20, 25,
        26, 28, 28, 30, 28, 25, 28, 33, 42, 42, 36, 23, 9, 0, 1, -4, 1, -4, -4, 1, 5, 9, 9, -3, -1, -18, -50, -108, -190,
        -272, -340, -408, -446, -537, -643, -777, -894, -920, -853, -697, -461, -251, -60, 58, 103, 129, 139, 155, 170, 173,
        178, 185, 190, 193, 200, 208, 215, 225, 224, 232, 234, 240, 240, 236, 229, 226, 224, 232, 233, 232, 224, 219, 219,
        223, 231, 226, 223, 219, 218, 223, 223, 223, 233, 245, 268, 286, 296, 295, 283, 271, 263, 252, 243, 226, 210, 197,
        186, 171, 152, 133, 117, 114, 110, 107, 96, 80, 63, 48, 40, 38, 34, 28, 15, 2, -7, -11, -14, -18, -29, -37, -44, -50,
        -58, -63, -61, -52, -50, -48, -61, -59, -58, -54, -47, -52, -62, -61, -64, -54, -52, -59, -69, -76, -76, -69, -67,
        -74, -78, -81, -80, -73, -65, -57, -53, -51, -47, -35, -27, -22, -22, -24, -21, -17, -13, -10, -11, -13, -20, -20,
        -12, -2, 7, -1, -12, -16, -13, -2, 2, -4, -5, -2, 9, 19, 19, 14, 11, 13, 19, 21, 20, 18, 19, 19, 19, 16, 15, 13, 14,
        9, 3, -5, -9, -5, -3, -2, -3, -3, 2, 8, 9, 9, 5, 6, 8, 8, 7, 4, 3, 4, 5, 3, 5, 5, 13, 13, 12, 10, 10, 15, 22, 17,
        14, 7, 10, 15, 16, 11, 12, 10, 13, 9, -2, -4, -2, 7, 16, 16, 17, 16, 7, -1, -16, -18, -16, -9, -4, -5, -10, -9, -8,
        -3, -4, -10, -19, -20, -16, -9, -9, -23, -40, -48, -43, -33, -19, -21, -26, -31, -33, -19, 0, 17, 24, 9, -17, -47,
        -63, -67, -59, -52, -51, -50, -49, -42, -26, -21, -15, -20, -23, -22, -19, -12, -8, 5, 18, 27, 32, 26, 25, 26, 22,
        23, 17, 14, 17, 21, 25, 2, -45, -121, -196, -226, -200, -118, -9, 73, 126, 131, 114, 87, 60, 42, 29, 26, 34, 35, 34,
        25, 12, 9, 7, 3, 2, -8, -11, 2, 23, 38, 41, 23, 9, 10, 13, 16, 8, -8, -17, -23, -26, -25, -21, -15, -10, -13, -13,
        -19, -22, -29, -40, -48, -48, -54, -55, -66, -82, -85, -90, -92, -98, -114, -119, -124, -129, -132, -146, -146, -138,
        -124, -99, -85, -72, -65, -65, -65, -66, -63, -64, -64, -58, -46, -26, -9, 2, 2, 4, 0, 1, 4, 3, 10, 11, 10, 2, -4,
        0, 10, 18, 20, 6, 2, -9, -7, -3, -3, -2, -7, -12, -5, 5, 24, 36, 31, 25, 6, 3, 7, 12, 17, 11, 0, -6, -9, -8, -7, -5,
        -6, -2, -2, -6, -2, 2, 14, 24, 22, 15, 8, 4, 6, 7, 12, 16, 25, 20, 7, -16, -41, -60, -67, -65, -54, -35, -11, 30,
        84, 175, 302, 455, 603, 707, 743, 714, 625, 519, 414, 337, 300, 281, 263, 239, 197, 163, 136, 109, 77, 34, -18, -50,
        -66, -74, -79, -92, -107, -117, -127, -129, -135, -139, -141, -155, -159, -167, -171, -169, -174, -175, -178, -191,
        -202, -223, -235, -243, -237, -240, -256, -298, -345, -393, -432, -475, -518, -565, -596, -619, -623, -623, -614,
        -599, -583, -559, -524, -477, -425, -383, -357, -331, -301, -252, -198, -143, -96, -57, -29, -8, 10, 31, 45, 60, 65,
        70, 74, 76, 79, 82, 79, 75, 62,
    };

static void slider_x_event_cb(lv_event_t * e)
{
    lv_obj_t * obj = lv_event_get_target(e);
    int32_t v = lv_slider_get_value(obj);
    lv_chart_set_zoom_x(chart, v);
}

static void slider_y_event_cb(lv_event_t * e)
{
    lv_obj_t * obj = lv_event_get_target(e);
    int32_t v = lv_slider_get_value(obj);
    lv_chart_set_zoom_y(chart, v);
}

/**
 * Display 1000 data points with zooming and scrolling.
 * See how the chart changes drawing mode (draw only vertical lines) when
 * the points get too crowded.
 */
void lv_example_chart_5(void)
{
    /*Create a chart*/
    chart = lv_chart_create(lv_scr_act());
    lv_obj_set_size(chart, 200, 150);
    lv_obj_align(chart, LV_ALIGN_CENTER, -30, -30);
    lv_chart_set_range(chart, LV_CHART_AXIS_PRIMARY_Y, -1000, 1000);

    /*Do not display points on the data*/
    lv_obj_set_style_size(chart, 0, LV_PART_INDICATOR);

    lv_chart_series_t * ser = lv_chart_add_series(chart, lv_palette_main(LV_PALETTE_RED), LV_CHART_AXIS_PRIMARY_Y);

    uint32_t pcnt = sizeof(ecg_sample) / sizeof(ecg_sample[0]);
    lv_chart_set_point_count(chart, pcnt);
    lv_chart_set_ext_y_array(chart, ser, (lv_coord_t *)ecg_sample);

    lv_obj_t * slider;
    slider = lv_slider_create(lv_scr_act());
    lv_slider_set_range(slider, LV_IMG_ZOOM_NONE, LV_IMG_ZOOM_NONE * 10);
    lv_obj_add_event_cb(slider, slider_x_event_cb, LV_EVENT_VALUE_CHANGED, NULL);
    lv_obj_set_size(slider, 200, 10);
    lv_obj_align_to(slider, chart, LV_ALIGN_OUT_BOTTOM_MID, 0, 20);

    slider = lv_slider_create(lv_scr_act());
    lv_slider_set_range(slider, LV_IMG_ZOOM_NONE, LV_IMG_ZOOM_NONE * 10);
    lv_obj_add_event_cb(slider, slider_y_event_cb, LV_EVENT_VALUE_CHANGED, NULL);
    lv_obj_set_size(slider, 10, 150);
    lv_obj_align_to(slider, chart, LV_ALIGN_OUT_RIGHT_MID, 20, 0);
}

#endif