How to draw square waveform using LVGL chart

Description

I need to draw dynamic square waveform using LVGL chart

What MCU/Processor/Board and compiler are you using?

Beagle Bone Black

What LVGL version are you using?

8.3

What do you want to achieve?

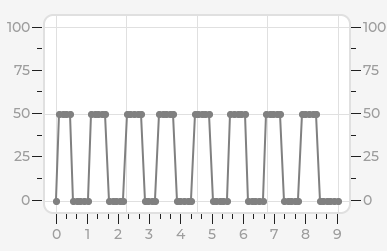
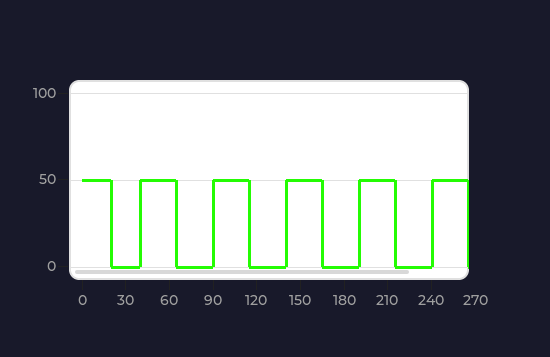
Square waveform using LVGL chart, something like this,

What have you tried so far?

I used LVGL chart for drawing square waveform, but i am missing something, i am only getting triangular wave not square wave. Need help on this please.

Code to reproduce

void Chart::drawchart(void)
{
    chart = lv_chart_create(lv_scr_act());
    lv_obj_set_size(chart, 200, 150);
    lv_obj_align(chart, LV_ALIGN_CENTER, 0, -10);
    lv_chart_set_type(chart, LV_CHART_TYPE_LINE);

    lv_chart_set_axis_tick(chart, LV_CHART_AXIS_PRIMARY_Y, 10, 5, 6, 5, true, 40);
    lv_chart_set_axis_tick(chart, LV_CHART_AXIS_PRIMARY_X, 10, 5, 10, 1, true, 30);

    lv_obj_refresh_ext_draw_size(chart);

    cursor = lv_chart_add_cursor(chart, lv_palette_main(LV_PALETTE_BLUE), LV_DIR_LEFT | LV_DIR_BOTTOM);

    ser = lv_chart_add_series(chart, lv_palette_main(LV_PALETTE_RED), LV_CHART_AXIS_PRIMARY_Y);

    lv_chart_set_next_value(chart, ser, 0);
    lv_chart_set_next_value(chart, ser, 80);
    lv_chart_set_next_value(chart, ser, 0);
    lv_chart_set_next_value(chart, ser, 80);
    lv_chart_set_next_value(chart, ser, 0);
    lv_chart_set_next_value(chart, ser, 80);
    lv_chart_set_next_value(chart, ser, 0);
    lv_chart_set_next_value(chart, ser, 80);
    lv_chart_set_next_value(chart, ser, 0);
    lv_chart_set_next_value(chart, ser, 80);

    lv_chart_set_zoom_x(chart, 500);
}

Screenshot and/or video
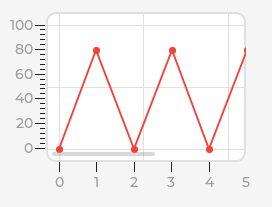
image

Hello, I think you somehow need to create a point on the same X axis with a higher Y first, then the next point with higher Y, and then when it drops again, remain on the X axis and lower Y again.

But as far as I know lv_chart_set_next_value() adds the value to an array with the Y axis and automatically scales the horizontal axis. All charts seem to work with automatic scaling in horizontal/X axis.

Maybe something like this works:

lv_chart_set_next_value(chart, ser, 0);
lv_chart_set_next_value(chart, ser, 80);
lv_chart_set_next_value(chart, ser, 0);
lv_chart_set_next_value(chart, ser, 80);
lv_chart_set_next_value(chart, ser, 0);

But I doubt it… You might even have to draw lines yourself…

1 Like

Thanks for the reply,

I have tried what you mentioned. I have output like this. i did not set any style for now. It looks fine, but still the lines are not perpendicular, which is needed in my case.
image

Can you please point me to the docs on how to draw lines in chart.

I’m not sure about the possibility of putting this into a chart, but you would need to use lv_line(). Line (lv_line) — LVGL documentation.

I got the idea on drawing lines, is there any API to get the pixel(point) values of the chart at particular position (if data points can be used), is it feasible to do so?

No API for that as far a I know.
I also realised you could try looking at the lv_chart source code to see if you could maybe create functionality for setting both X and Y position, instead of the X position being calculated for you… In the end, the lv_chart portion just uses existing functions for drawing the points and lines. Perhaps some reverse-engineering will work well.

Will check it and see, if this helps my case.

Hello,

This question interests me, I have been looking at the lv_chart code to see what can be done… and apparently it is possible to set the x and y of a point!!

/**
 * Set the next point's X and Y value according to the update mode policy.
 * @param obj       pointer to chart object
 * @param ser       pointer to a data series on 'chart'
 * @param x_value   the new X value of the next data
 * @param y_value   the new Y value of the next data
 */
void lv_chart_set_next_value2(lv_obj_t * obj, lv_chart_series_t * ser, lv_coord_t x_value, lv_coord_t y_value);

See the examples here: Chart (lv_chart) — LVGL documentation

Surely you can draw a line between these points…

Ok, will check this API usage for drawing lines between points.

I have checked the function, it will only work for scatter chart not for other charts.

I could achieve the behavior using canvas and drawing rect and line. The styles, color and position need to be modified, but could achieve square wave over all.

1 Like

I tried drawing square waveform using scatter chart instead of line chart, i was able to do it. I used the function you suggested, thank you.

void lv_chart_set_next_value2(lv_obj_t * obj, lv_chart_series_t * ser, lv_coord_t x_value, lv_coord_t y_value);

image

1 Like