Description
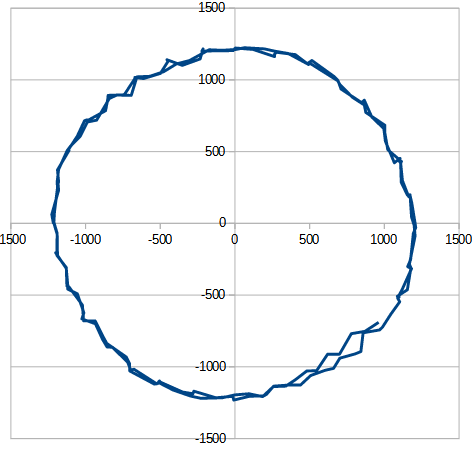
I would like to plot two stepper motor signals as a Lissajous graph such that users can examine their relative phase and amplitude (should be sin/cos waves of same amplitude, resulting in a circle like shape).
Input is a vector of ~200 pairs of <x, y>. Can also convert to polar coordinates if needed.
What is a reasonable way to do it with LVGL? Can be for example with a scatter or with a polar chart.
What MCU/Processor/Board and compiler are you using?
STM32F401CE.
What LVGL version are you using?
#define LVGL_VERSION_MAJOR 7
#define LVGL_VERSION_MINOR 9
#define LVGL_VERSION_PATCH 1
#define LVGL_VERSION_INFO “dev”
What do you want to achieve?
Display the graph above.
What have you tried so far?
Searched lvgl documentation for ‘scatter’ and ‘polar’. The ‘best’ idea I have now is using a chart with no series for the grid and somehow use a lv_line to draw the polyline between the scatter points.
Code to reproduce
None.
Screenshot and/or video
None available.