I’m following the widgets_demo from lvgl_demos project. I need to display a chart that can show floating point values.
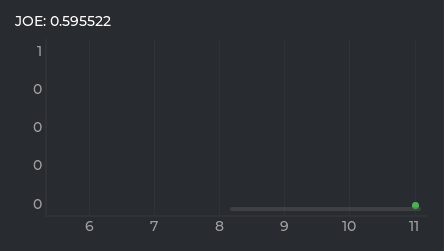
Currently it seems the chart widget only takes integer values. As presented in the following image:

Is there a way I can use the chart for floating-point values or do I have to modify the existing widget?
Thanks.
PS: Storage, ram and cpu cycles are of no concern. The program will run on a rpi.