Description
I have a working chart where I plot a real-time stream of values. I currently set the chart to have 100 points, but would to set it to the exact plot area width in pixel to have max resolution data. Same go for the setting the Y range. How do I determine the exact size of the plot area?
What MCU/Processor/Board and compiler are you using?
STM32F401
What LVGL version are you using?
LVGL_VERSION_MAJOR 7
LVGL_VERSION_MINOR 5
LVGL_VERSION_PATCH 0
LVGL_VERSION_INFO “dev”
What do you want to achieve?
My chart having number of points which is exactly the width of the plot area in pixels.
What have you tried so far?
Looked for an lv function that returns the size of Chart’s plot area.
Code to reproduce
This is how I initialize the chart styles:
static void init_chart_styles() {
  // Background style
  lv_style_init(&chart_styles.bg);
  lv_style_set_radius(&chart_styles.bg, LV_STATE_DEFAULT, 0);
  lv_style_set_bg_color(&chart_styles.bg, LV_STATE_DEFAULT,
                        LV_COLOR_BLACK);  // BLACK

  lv_style_set_text_font(&chart_styles.bg, LV_STATE_DEFAULT,
                         &font_montserrat_alphanum_12);
  lv_style_set_text_color(&chart_styles.bg, LV_STATE_DEFAULT, LV_COLOR_SILVER);

  lv_style_set_border_width(&chart_styles.bg, LV_STATE_DEFAULT, 0);
  lv_style_set_outline_width(&chart_styles.bg, LV_STATE_DEFAULT, 0);

  lv_style_set_pad_top(&chart_styles.bg, LV_STATE_DEFAULT, 10);
  lv_style_set_pad_bottom(&chart_styles.bg, LV_STATE_DEFAULT, 10);
  lv_style_set_pad_right(&chart_styles.bg, LV_STATE_DEFAULT, 0);
  lv_style_set_pad_left(&chart_styles.bg, LV_STATE_DEFAULT, 25);

  // Series style
  lv_style_init(&chart_styles.series);
  lv_style_set_size(&chart_styles.series, LV_STATE_DEFAULT, 0);
  lv_style_set_line_width(&chart_styles.series, LV_STATE_DEFAULT, 2);

  // Series bg style
  lv_style_init(&chart_styles.series_bg);
  lv_style_set_line_dash_gap(&chart_styles.series_bg, LV_STATE_DEFAULT, 0);
  lv_style_set_line_color(&chart_styles.series_bg, LV_STATE_DEFAULT,
                          LV_COLOR_MAKE(0x00, 0x40, 0x00));  // dark green
}
And this is how I create the chart:
void create_chart(const Screen& screen, Chart* chart) {
  init_styles_if_needed();

  lv_obj_t* lv_chart = lv_chart_create(screen.lv_screen, NULL);

  lv_obj_set_size(lv_chart, 420, 220);

  lv_obj_align(lv_chart, NULL, LV_ALIGN_CENTER, 0, 0);
  lv_chart_set_type(lv_chart, LV_CHART_TYPE_LINE);

  lv_chart_set_update_mode(lv_chart, LV_CHART_UPDATE_MODE_SHIFT);

  // TODO: set this to actual number of X pixels.
  lv_chart_set_point_count(lv_chart, 100);

  /*Add two data series*/
  lv_chart_series_t* lv_series1 =
      lv_chart_add_series(lv_chart, LV_COLOR_YELLOW);
  lv_chart_series_t* lv_series2 =
      lv_chart_add_series(lv_chart, LV_COLOR_ORANGE);

  lv_obj_add_style(lv_chart, LV_CHART_PART_BG,
                   &chart_styles.bg);  // apply background style
  lv_obj_add_style(lv_chart, LV_CHART_PART_SERIES,
                   &chart_styles.series);  // Apply part series style.
  lv_obj_add_style(lv_chart, LV_CHART_PART_SERIES_BG,
                   &chart_styles.series_bg);  // apply series background style

  lv_chart_set_y_tick_length(lv_chart, 0, 0);
  lv_chart_set_y_tick_texts(lv_chart, "-2\n-1\n0\n1\n2", 3,
                            LV_CHART_AXIS_DRAW_LAST_TICK);

  chart->lv_chart = lv_chart;
  chart->ser1.lv_chart = lv_chart;
  chart->ser1.lv_series = lv_series1;
  chart->ser2.lv_chart = lv_chart;
  chart->ser2.lv_series = lv_series2;
}
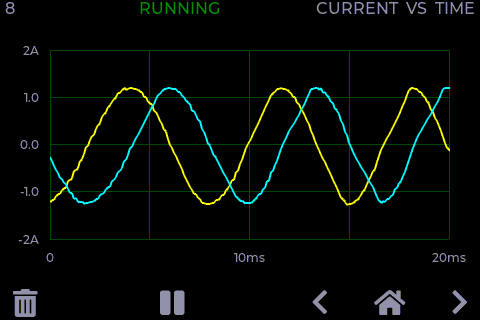
Screenshot and/or video
If possible, add screenshots and/or videos about the current state.