Description
I want to create an flexible chart.
What MCU/Processor/Board and compiler are you using?
STM32F429
What LVGL version are you using?
V7.2.0
What do you want to achieve?
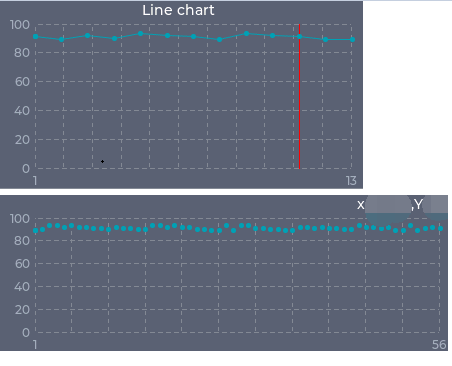
1、its type is only point or point + line .
2、 the first point of “Series” on the left of “series_area” and the last point on the right of “series_area”
3、its has one indicator line . change its x value to change its pos,then show the point value
4、I want set the chart title ,show the means of X axis and Y axis , and show the means of per series.
5、x value the point in “series” not in proper order. eg:
series has points [1,x]、[2,x]、[3,x]、[5,x]、[9,x]、[11,x]…
What have you tried so far?
1、I add an new type ,which only draw point And not draw line in draw_series_line function
2、geting new point,change the point number of chart
3、I draw one red vert line in draw_series_line function,and x pos of red vert line can be changed.
4、I set title by lv_obj_set_style_local_value_str,and lv_obj_set_style_local_XXX to change its pos.
5、I think I have to implement it myself 
Code to reproduce
The code block(s) should be formatted like:
/*You code here*/
Screenshot and/or video
I can not upload screenshots.!
I would be very glad if somebody can help me!