Description
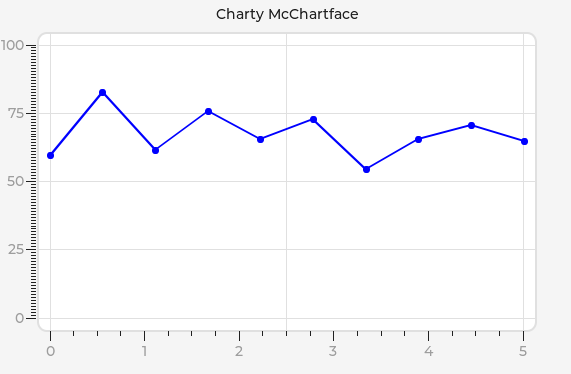
In version 8 how can I change the X axis tick range + text to become similar to to this chart created in v7
I want the values to shift along showing me the current reading and the history.
Currently I can’t get the axis ticks to say anything other than “0” to (eg) “10”
What MCU/Processor/Board and compiler are you using?
Simulator
What LVGL version are you using?
master
What do you want to achieve?
Custom tick range + units
What have you tried so far?
lv_chart_set_range()
Code to reproduce
Body of my “create_chart” function:
    lv_obj_t * chart = lv_chart_create(lv_scr_act());
    lv_obj_set_size(chart,500,300);
    lv_obj_align(chart,LV_ALIGN_CENTER,x_pos,y_pos);
    lv_chart_set_type(chart,LV_CHART_TYPE_LINE);
    lv_chart_set_div_line_count(chart,5,3);

    lv_chart_set_update_mode(chart,LV_CHART_UPDATE_MODE_SHIFT);
    lv_chart_set_point_count(chart,no_points);

    lv_chart_set_range(chart,LV_CHART_AXIS_PRIMARY_X,-100,50);
    lv_chart_set_axis_tick(chart,LV_CHART_AXIS_PRIMARY_X,10,5,6, 4, true, 40);
    lv_chart_set_axis_tick(chart,LV_CHART_AXIS_PRIMARY_Y,10,5,5,23,true,40);

    series = lv_chart_add_series(chart,color,LV_CHART_AXIS_PRIMARY_Y);
    for (int i = 0; i < no_points; i++)
    {
        series->y_points[i] = 0;
    }

    lv_chart_refresh(chart);

    if(name)
    {
        lv_obj_t *lbl_obj_title = lv_label_create(lv_scr_act());
        lv_label_set_text(lbl_obj_title,name);
        lv_label_set_recolor(lbl_obj_title, true);
        lv_obj_align_to(lbl_obj_title, chart, LV_ALIGN_OUT_TOP_MID, 0, -10);
    }

    return chart;
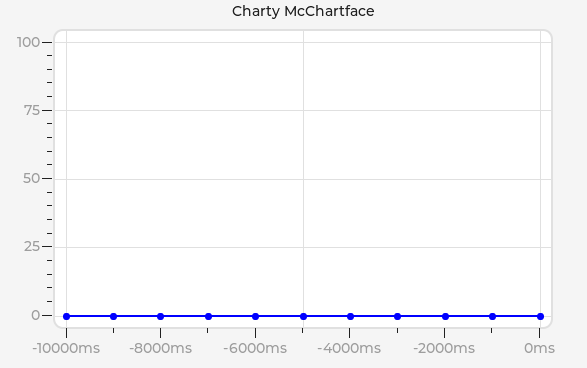
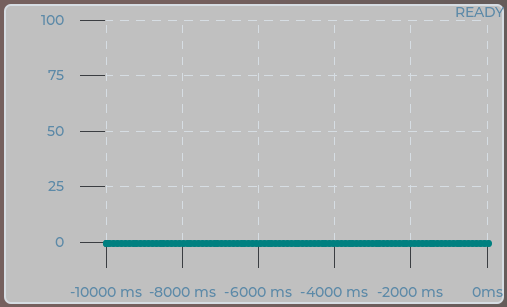
Screenshot and/or video
Current state