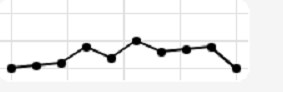
    lv_obj_t* chart_2 = lv_chart_create(lv_scr_act());
    lv_obj_set_size(chart_2, 202, 66);
    lv_chart_set_range(chart_2, LV_CHART_AXIS_PRIMARY_Y, 80, 100);
    lv_obj_set_style_border_width(chart_2, 0,0);
    lv_chart_set_type(chart_2, LV_CHART_TYPE_LINE);
    lv_obj_align_to(chart_2, lv_scr_act(), LV_ALIGN_TOP_LEFT, 0, 0);

    lv_chart_series_t* chart_ser = lv_chart_add_series(chart_2, lv_color_make(0x00,0x00,0x00), LV_CHART_AXIS_PRIMARY_Y);
    lv_chart_set_x_start_point(chart_2, chart_ser, 0);
    for (uint8_t i = 0; i < 10; i++)
    {
        lv_chart_set_next_value(chart_2, chart_ser, arr_weight[i]);
    }
    lv_obj_set_style_line_color(chart_2, (lv_color_t)LV_COLOR_MAKE(0x0A, 0xF8, 0xFC), LV_PART_ITEMS);
result:
/================If so modified========================/
Modify the file lv_chart.c
function: static void draw_series_line(lv_obj_t * obj, lv_draw_ctx_t * draw_ctx)
        if(ser->hidden) continue;
       // line_dsc_default.color = ser->color;     /* modified point */
        point_dsc_default.bg_color = ser->color;
result:

Is this a design or a bug?
Are there other ways to achieve this effect?