I’m trying to create a gauge where the labels on the major ticks are different to the values in the scale.
I am using two scales, the first is the scale I use for displaying the right value, and the second to use for the labels. However the Major ticks of the first scale overlay the Major ticks of the second scale (they are different colors )
Is there a better way to accomplish this, or am I on the right track (and how can I stop the white ticks of the first scale showing on the black major ticks of the second) ?
Context is that I want to draw a gauge where each ‘segment’ of the arch is half a value of the major ticks. If the major ticks are 5, I would like 10 segments between 0 and 5 (so I can draw half values)
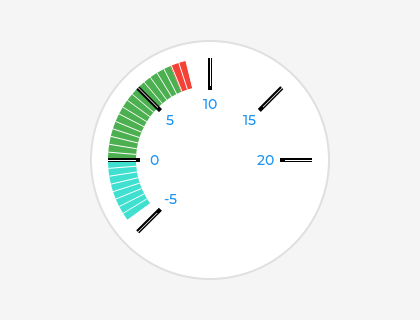
This is my code here
which generates this