Drawing functions lv_canvas_draw_line, lv_canvas_draw_arc, etc. - work with integer coordinates - is not enough for accurate graph output:

I propose to add similar functions that accept float coordinates as input (lv_canvas_draw_float_line)

Drawing functions lv_canvas_draw_line, lv_canvas_draw_arc, etc. - work with integer coordinates - is not enough for accurate graph output:
I propose to add similar functions that accept float coordinates as input (lv_canvas_draw_float_line)
It is wise to use integers. In your case you should use a high resulotion monitor, in case of embedded systems, high resulotion LCD.
I ask you a question. In case of using floating variable in functions, what does it mean for the monitor?
It should color some percent of a pixel with one color and the rest with one other? In the hardware level it is not possible.
When drawing with integer coordinates, it is assumed that the line is drawn from the center of the pixel,
but not through the centers of intermediate pixels:
If the coordinates are float, then the beginning and end of the line do not have to be located in the center of the line - the drawing algorithm itself can work as before, with integers, only with different initial conditions:
In my example, the first picture is drawn using LVGL, and the second is Windows GDI - whose functions take float coordinates:
public void DrawLine(Pen pen, float x1, float y1, float x2, float y2)
As LVGL primarily targets embedded systems we don’t use floats at all to keep LVGL fast on all platforms.
I was thinking on a modular draw layer to allow using different engines easily and with some configs make possible to use float there.
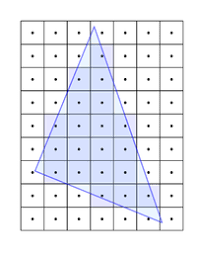
E.g. HTML/CSS support fraction pixels. See this two images:
x=25.2px
x=25.8px
It is not necessary to use float, for example fixed point coordinates. But even when using float - the algorithm itself inside the rasterization function remains integer - I suggest using float only to improve rendering accuracy, and these additional functions do not have to be used on all platforms. I am using STM32H743 which has FPU - and it is an embedded platform.
@kisvegabor How feasible would it be to allow lv_coord_t to be defined as float instead of int32_t, in order to avoid changing any APIs, and simply add logic to the renderer to take this into account?
The main complexity I see is that vertical & horizontal lines are no longer guaranteed to be pixel-aligned, so the logic for drawing even a basic rectangle would need antialiasing ability.
Add a new type - lv_float_coord_t - and new rendering functions that will work with that type. This will not interfere with the already existing API.
It’s charming but doesn’t negate what I mentioned. The lines aren’t started from a place inside a single pixel, but they occupy all of a pixel. They are supposed to simulate these features.
I propose such rendering only for the canvas - drawing on the canvas does not create any objects and does not interfere with the logic of the rest of the library in any way.
@fedorlov The issue is that the canvas is really using the exact same rendering logic as a display behind the scenes (example), so this feature really has to be in LVGL’s core.
OK, I see that in the current library concept this is not possible to implement. But this idea may come in future versions. For myself, I have implemented a simple function so far
canvas_float_line (lv_obj_t * canvas, float x1, float y1, float x2, float y2, float width, lv_color_t color)
which does not use other functions LVGL
Чувак, lvgl заточен под работу с растровой графикой. Ты хочешь работать с векторными примитивами, ну ок, пиши свои функции с алгоритмом Брезенхема или подобными.
embeddedt - translated via Google Translate:
Dude, lvgl is tailored for working with raster graphics. You want to work with vector primitives, well, ok, write your functions with Bresenham’s algorithm or similar.
I was thing about it too, but the “simply add logic to the renderer” part is actually very complex. ![]()
As I mentioned earlier, IMO allowing to change the renderer engine would be more feasible.
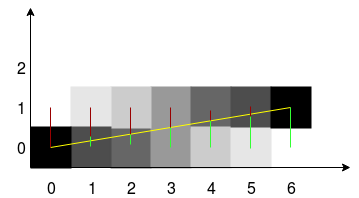
Sometimes you can use simple trick to solve complex problem.
Long time ago, I wanted to plot data that was between 0 - 10 with one decimal point, so all I did was I multiplied all data points by 10 to get rid of the decimal, and make them pretty much integers, and then plotted them as integers.
You can do this for values larger than 10, but then you will have to scroll the plot to see more, which might not be too bad in some situations.