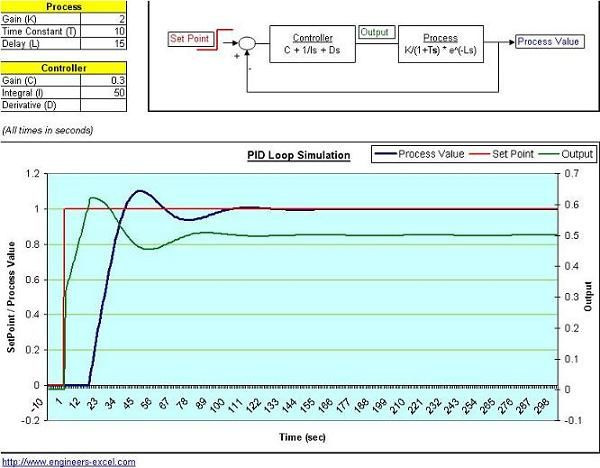
I would like to draw a simple curve (such as PID curve) with LVGL chart widget.
My project is about Control Systems and PID controll. I need create a simple GUI to control any process, but I also need show to user the curve of PV and other variables.
What MCU/Processor/Board and compiler are you using?
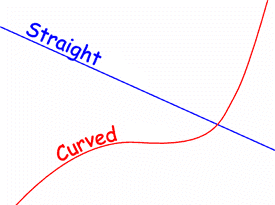
@Ali_Rostami It is not about “add different series”, it is about how to draw a “curve graph”. curve, not just straights connecting dots. LVGL don’t support float numbers, so, I can’t create a “curve effect”, just a “straight effect”:
I would like to know how can I create a graph with this “curve effect”.
Did you understand my question @Ali_Rostami?
Sorry about my English.
Yeah, no problem.
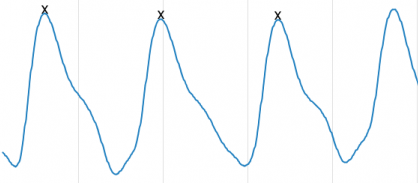
OK, in fact, you can get to this curve by having more points on the chart. In my project I have to display something like this:
And I have no problem.
For setting float numbers, you can multiply your data to e.g 100 -based on your precision- and then add them to the chart.
For example, let’s say your numbers varies from 0.00 to 1.20 so if you multiply them to 100 you have the range of 0 to 120: lv_chart_set_range(chart, 0, 120);
Hi @Ali_Rostami. Thanks for your reply.
I understand fixed-point math, makes sense, but I dont understand how create this “curve” effect. Just add more points looks not enough. Can you share your example with me?
The only difference between fixed and floating point math is that the latter allows any number of decimals, while the former has a fixed number. Otherwise, they behave exactly the same. In many cases, you wouldn’t notice a difference.
The curve effect shouldn’t be related to the type of math in use, as it controls how the lines between points are rendered, not the values of the points themselves.
Not sure what you mean.
But In my case, whenever I receive new data from the sensor I call a function that has this line to draw next Y, based on the new data. lv_chart_set_next(chart, series, y);
I do nothing more man. The config of the chart is as I posted and this is the way I add new data every time. Hope this can help👍
If it didn’t help, put your code here -the config and the part you add new data to the chart- to see if we can do anything about it.
I think the draw functions in the canvas are a better option. You can probably modify the line drawing code from the chart using draw arc. Might even be best to make that the default drawing method for the chart widget or an additional option. If the default angle is 0 it would draw straight lines and if the “smoothing” option is activated it could calculate the right start and end angle to draw a curve.
lv_canvas_draw_arc(canvas, x, y, radius, start_angle, end_angle, &draw_dsc)
If you upload your code I can give it a try later. I am working right now so I don’t have time to recreate your whole setup from scratch.
Guys @excitedbox, @Lucas.Liao, @Ali_Rostami sorry for the late reply. I can’t retry your suggestions right now but I’ll try as soon as possible and I’ll give you feedback. Maybe I can write a tutorial for other people who want do the same thing. Thank you very much guys.