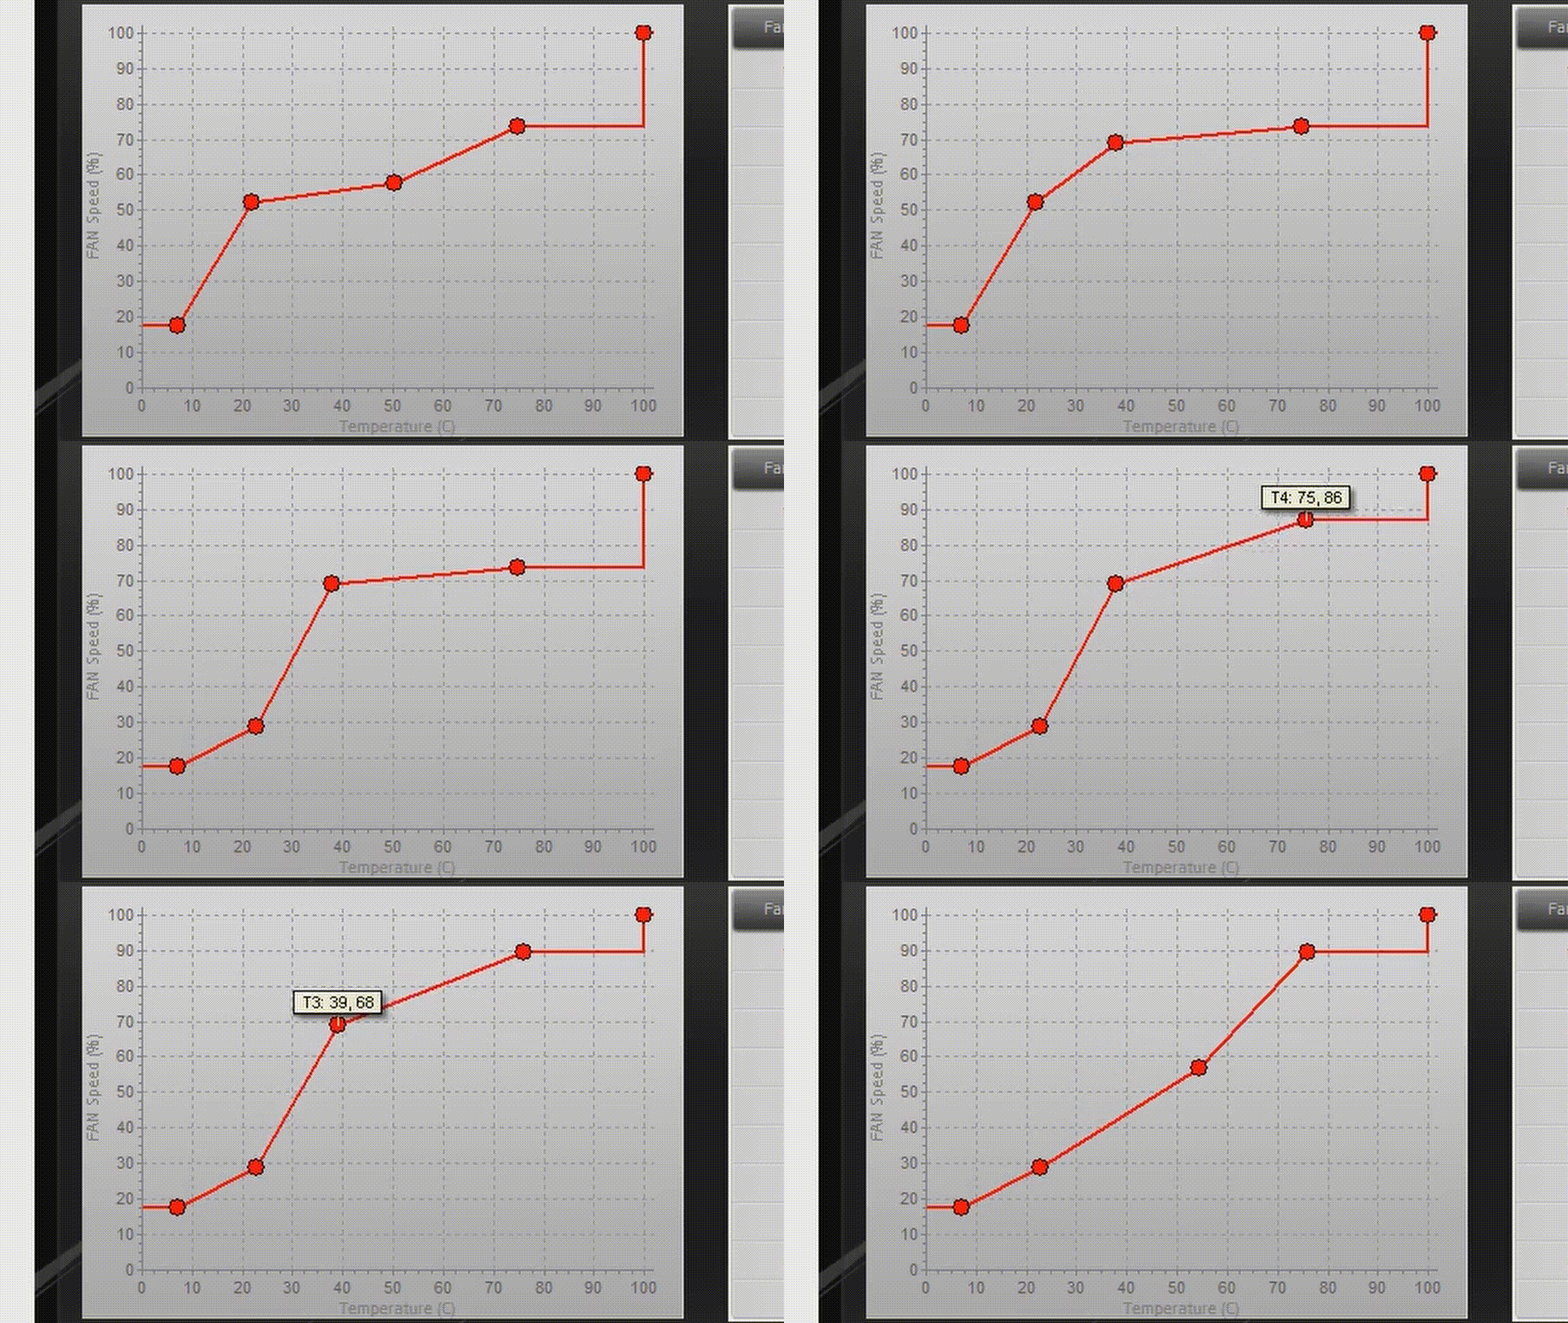
Hi All,
Any lv_chart features that are similar to the screenshot below?

So the chart is can be directly changed when the point is dragged.
From what I see in the latest documentation, the nearest features is this:
Show cursor on the clicked point
Except it can’t be directly changed nor dragged.
Any suggestions are appreciated!
Regards,
TJ.
Hi TJ,
It’s not supported out of the box but you can use lv_chart_get_pressed_point to get the index of the pressed point and set a new value with lv_chart_set_value_by_id.
Got it,
I will try your suggestion.
Regards,
TJ.
Hi Gabor,
lv_chart_get_pressed_point are for getting the id, but how to get a coordinate for where I click in chart area so I can set a new value using lv_chart_set_value_by_id ?
Regards,
TJ.
I get it now but really there is no API for it now. 
I think all it should do is scaling the Y coordinate of the clicked point according to the range of the chart. Is it correct?
There is no direct API but it can be done.
If you know what the scale is for the x and y axis on the graph you can get the x, y touchscreen coordinates from LVGL. You would have to may the coordinates to the scale on the graph but that shouldn’t be too hard to do. Then you can set the point
But LVGL use fixed gap for every point, while in the screenshot above the axis are dynamically changed.
Yes what I see in LVGL, the chart are using same gap size for every point, while in screenshot the X axis are flexible.
all of the pieces are in place already in LVGL. It simply doesn’t work tho. not sure why it doesn’t.
https://sim.lvgl.io/v9.0/micropython/ports/javascript/index.html?script_startup=https://raw.githubusercontent.com/lvgl/lvgl/12b9e8809e3de16b6d62e019bd73f61fd974e15a/examples/header.py&script=https://raw.githubusercontent.com/lvgl/lvgl/12b9e8809e3de16b6d62e019bd73f61fd974e15a/examples/widgets/chart/lv_example_chart_4.py&script_direct=0c6ed293df18232d5704b094d48e6c76ebfb0b07
in the above simulator you can see the proper coordinates getting printed out. The first x, y is the location of the point. the second one is where the touch is.
There are several bugs in the chart widget. The first one being the inability to set the position of the point using the ID. It doesn’t work. The second one is no matter where you click on the chart it manages to lock onto a point as being clicked on even if you don’t click on a point. I will be opening up a bug report for this tomorrow morning.
You can use the SCATTER chart type for this purpose.
Good, I think the LV_CHART_TYPE_SCATTER are what I need.
But I got another problem, lv_chart_get_pressed_point always return 0 when using LV_CHART_TYPE_SCATTER
Yes, in get_index_from_x the SCATTER type is not handled. If you have time to work on it, please open a new issue or Pull request.
